Time Range
Overview
The Time range analysis module gives you a broad picture of your business process health. It helps you to overview how your events order, balance, extend, overlap, or isolate in your process. This module shows the time range of the event occurrences relative to the start of the timelines.
It is a general-purpose instrument that can prove itself useful in very different scenarios. For example, compare the order of all events to reveal violations and consequently investigate certain parts of a business process.
Select Time range in the drop-down list under the project name to open this analysis module.
Workspace
The Time range diagram does not require an initial configuration and appears with the currently active events and filtering applied. Time range orders events based on their Median/Average occurrence time. For example, the first top event on average appears in timelines closer to the beginning than other events.
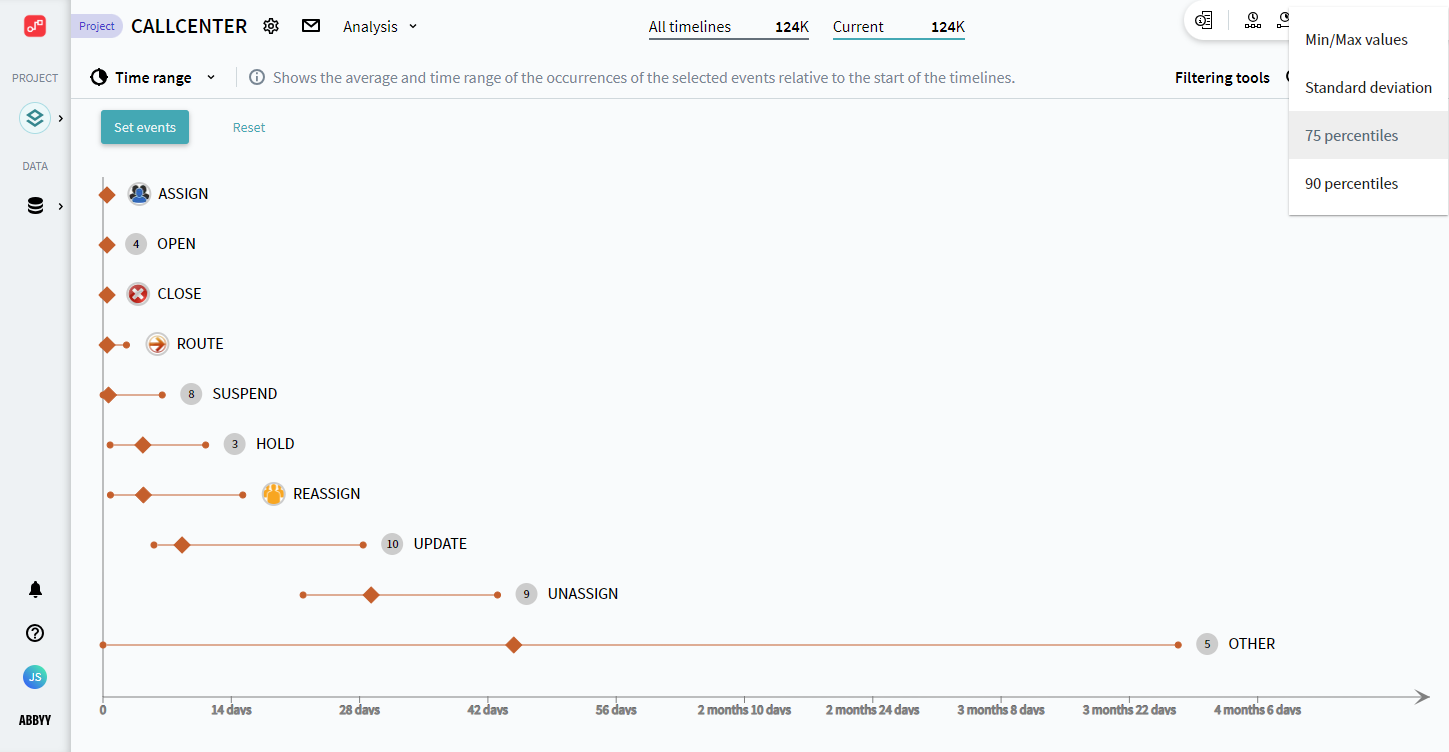
Learn more on the workspace sections from the list below.
- X-axis
Scale, representing the time of an event occurrence, relative to the start of a timeline. - Event segment
All occurrences of the selected events form vertically ordered line segments in accordance with the timescale, from the earliest event occurrence to the latest. Hover the mouse over an event line to see detailed event statistics. The order of segments is based on the Median/Average value of the event occurrence time from the top to the bottom. - Range options
The selected statistics range determines the event segment values and boundaries.
How to configure
The Time range diagram appears with the currently active events and filtering applied. Configure events and statistics range options to adjust the diagram to your needs.
- Select events to display on the diagram.
Click Set events in the top left corner, choose events, and click Add.
Note. All event occurrences in timelines are considered for statistics. - Select a range option.
- Click the range option drop-down list in the top left corner.
- Select any of the statistic range options in the top right corner.
The Time range diagram automatically rebuilds for the selected range.
When you work with Time range analysis, it always shows statistics for the currently selected timelines. Pay attention to the filters that select timelines to explore in the Current block at the top. To learn more, see Effects of Current filters. Experiment with different filtration to narrow the number of investigated timelines.
9/5/2024 4:23:54 PM