Process View
Overview
The analysis of business processes is a complex and challenging task, where visualization is one of the most beneficial assistants. Approaching its tools, Timeline tends to develop "one glance" opportunities for users, that need to gather a giant amount of information on one screen and work with it simultaneously. For this purpose, Timeline 6.0 offers a new powerful visualization tool - Process view. This feature combines a schema view and a highly interactive board, making flexible custom analysis possible. It consists of two interactive schema views:
- Primary Path View - a new type of schema that helps to see the most frequent and common flow of events in timelines. It also allows finding deviations from the common flow and analyzing them further with the help of Timeline functionality.
- Milestone View - a standard process schema, powered with the tools of the new analysis module.
Along with the Views, you receive a unique possibility to customize and drill down to every little detail in your project proven by a highly interactive Board. Take most of the Timeline tools and your metrics, dimensions, and other custom elements to boost the effectiveness of the analysis.
There is a constant interaction between the schema and the View boards. For details on what impact Board elements have on Views and what filtering possibilities it offers, see Views and Boards Interactions, and Timeline Set Filtering.
To use this analysis module, select Process View in the drop-down list under the project's name.
Workspace
To help in finding and explaining the deviations, the Process view offers a split view consisting of two parts: a schema on the left, and a metrics Board on the right. You can adjust their sizes by dragging the line between them.
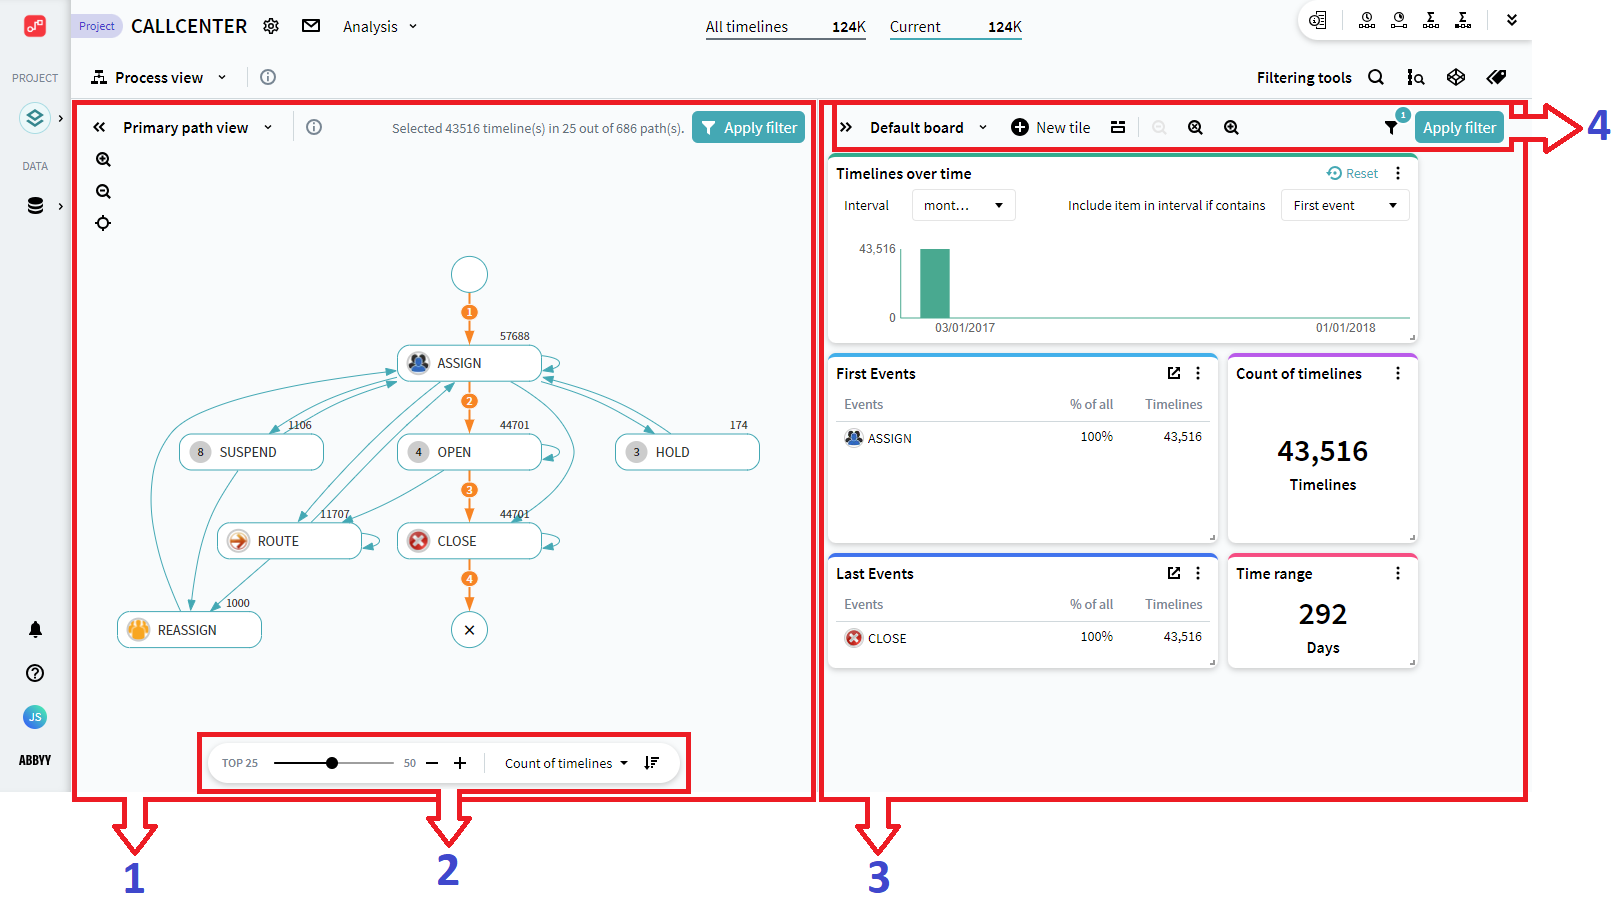
Learn more details on the workspace sections from the list below. Numbers in the list correspond to those on the picture:
- The View side displays a process schema with statistics and controls by which you can filter the schema content. You can switch between two views: Primary path view and Milestone view keeping the current Board configuration.
- At the bottom of the section is the schema controls pane. For example, pulling the slider in the Primary path view allows to increase or decrease the number of displayed deviations.
- On the right side is a Board of metric visualizations with Tiles on it. Tiles can represent events statistics, the number of timelines in the current set, time range, or custom charts. You can use and edit the existing charts, create new ones and configure the Data table. Tiles' goal is to help understand the consequences of the deviations selected on the View side.
- At the top of the Board are its controls. You can switch between views, add new tiles, and apply them as filters to the current set in the project.
When it comes to visual analysis, it is highly important to have full control over the display of the involved components. Process view offers the necessary opportunities to use the operating space most ergonomically:
- Change the sizes of View and Board by moving the line between them.
- Hide one of the sides to focus on the other by clicking
 or
or  .
. - Drag and drop Tiles to place them exactly where you need them, and pull their corners to resize.
05.09.2024 16:23:54