Metrics Panel
Overview
Metrics are various statistics related to timelines, that reveal a process from different angles. When you upload data to the project, Timeline automatically calculates default metrics and displays them in the Metrics panel.
When you work with the Metrics panel, they always show statistics for the currently selected timelines. Pay attention to the filters that select the timelines to explore in the Current section at the top. To learn more, see Effects of Current filters.
The Metrics panel is static. You cannot change the metric types presented here. However, you can create custom metrics to learn more about processes and workflow. For example, user-defined metrics are needed to configure Charts. For instructions on custom metrics, see Metrics.
Workspace
By default, the Metrics panel is represented as a toolbar in the top right corner of the program.

If you expand the toolbar by clicking the double arrows, the metrics preview opens, organized as a ribbon on the right of the program. You can pin the ribbon to save this display view while working with analysis modules.
Each preview relates to a certain metric and shows a short metric name, average, maximum, and minimum values of the metric. To calculate some statistics, the program uses events as a main component. Therefore, you can see an additional block with information about events in the panel.
In the table below, find more information about the Metrics panel content:
| Metrics panel | Content description |
|---|---|
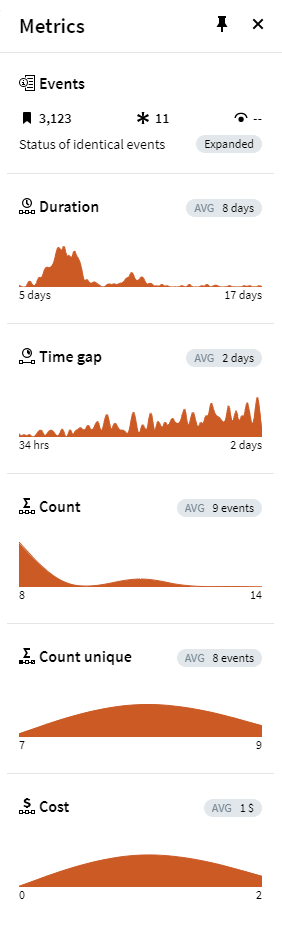 |
Events Overview statistics of events presented in timelines. Metrics are sensitive to event adjustment, as metrics consider the number of events and time gaps between them, cost of events, etc. To learn more about the Events block in the Metrics panel, see Events Section in Metrics Panel. |
|
Duration Shows the overall duration of timelines. This metric calculates the duration of each timeline and shows summary statistics for currently selected timelines. The Duration of timelines window opens by clicking on this preview. |
|
|
Time gap Shows the maximum time between two adjacent events in each timeline. The Maximum gap per timeline window opens by clicking on this preview. |
|
|
Count Shows the number of events in timelines. The Event count per timeline window opens by clicking on this preview. |
|
|
Count unique Shows the number of distinct events per timeline. The Unique event count per timeline window opens by clicking on this preview. |
|
|
Cost Displays the cost of timelines. The Cost metric appears when you configure a cost at least for one event in Cost configuration. Only events with configured costs are calculated. The Cost per timeline window opens by clicking on this preview. |
The metrics previews allow getting familiar with main the aspects of the process. Click the icon in the toolbar or click the metrics preview in the expanded ribbon to open more detailed statistics and configure additional settings in the metric window. You can break the metric down by dimension and create filters based on the selection created from metrics. The principle of working with the metric window is the same for all metrics in the panel. For details, see Metric Window.
05.09.2024 16:23:54