Metric Window
To open the metric window, click the corresponding icon in the toolbar, or click the metrics preview in the expanded ribbon with previews. The metric window displays detailed statistics for timelines. Here you can find:
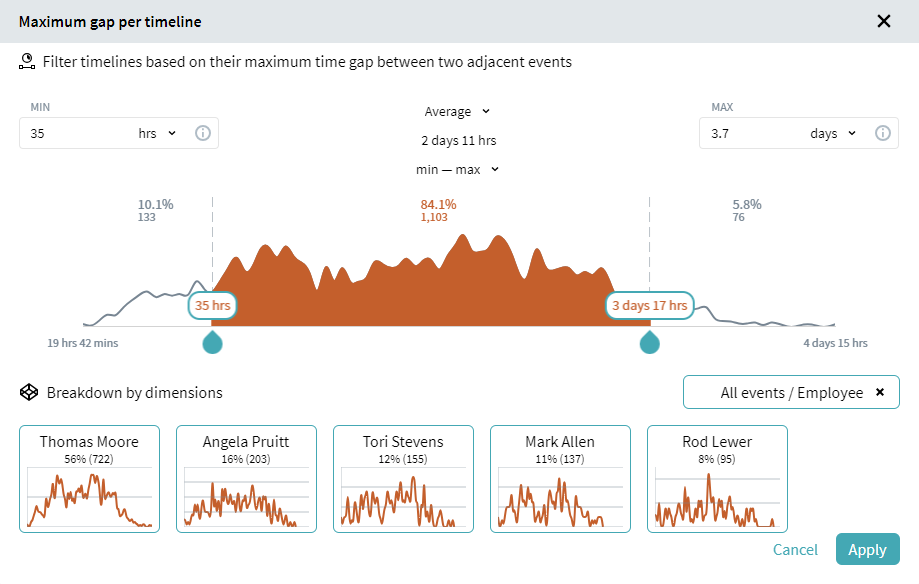
- Average, minimum, and maximum metric values
For time dimensions, you can select a step for minimum and maximum values representation. - Definitions of the metrics range: min - max, 75 percentile, 90 percentile
You can change it under the average value. Once configured, it is applied to all metrics in the panel. When you select a range, sliders on the histogram adjust automatically.
For details how the program calculate ranges, see Range Options. - A detailed interactive histogram
Sliders show the borders of the exploration values. For the chosen gap, the number and ratio of the belonging timelines are shown. See Working with histogram below to learn more. - Breakdown by dimensions
Select a dimension to see its distribution for the currently selected timelines in descending order. Changing borders on the histogram does not influence the dimensional data.
Click the certain dimension value to display its chart as a main histogram.
For more information on the Dimensions tool, see Dimensions.
Working with histogram
In the center of the metric window there is an interactive histogram. Sliders show the borders of the exploration values. For the chosen gap, the number and ratio of the belonging timelines are shown for the currently selected timelines.
Move the sliders to choose the area to discover. You will see the number of timelines related to the selected zone and the outer zones. The number and ratio from the overall timelines are always linked to the currently selected timelines.
You can use histograms for filtration. When you move sliders on the histogram, the zone in focus is colored orange. Click Apply to create a filter that selects timelines that fit the orange zone. The corresponding filter appears in the Current block at the top of the program.
Explore dimensional data of the selected timelines relative to a certain metric:
- Click +Select dimension... at the bottom.
- Choose an event (or all events) and an attribute in the Dimensions window.
- Click Select.
You will see how timelines belonging to a metric statistic distribute along the attribute values. Click a certain dimension to open its histogram. You will see the explorable attribute name at the top of the window. Now you can create a filter additionally based on the dimensional data for the metric.
05.09.2024 16:23:54