Dimensions
Overview
Dimensions are user-defined Attribute values related to a single event or all events in the project. The Dimensions tool makes it possible to create a separate analysis scope by filtering timelines based on the dimension value configured by user. Applied as a filter, it considers timelines where the selected attributes have certain values. This allows you to focus analysis on processes containing more specific aspects, which can be challenging to consider otherwise.
For example, you want to investigate the processes involving a certain employee in them, to assess their contribution to the workflow. In the uploaded data, you have a mapped attribute Employee, so with the help of the Dimensions filtering tool you can configure a dimension:
- Where this employee is involved in a certain event
- Where this employee is involved in any of the events
Then apply this dimension as a filter to sort out the timelines where the employee in question is not involved, and keep a set of timelines where this employee contributes.
Accordingly, you can use any attribute from your project data and focus on it. For instructions on how to create a dimension properly, see Dealing with Dimensions as a filtering tool.
Dimensions are presented in Timeline not only as a filtering tool but also as additional settings for some analysis modules or project configuration tools, where they have to be configured separately.
To open the Dimensions window, click  in Filtering tools at the top of the program.
Before you begin
Dimensions are based on Attribute values, which are automatically added to the project by mapping during the data upload. To be able to configure dimensions, make sure that the uploaded data contains additional columns mapped as Attributes.
For details on uploading data, see Data Requirements and Mapping.
Dealing with Dimensions as a filtering tool
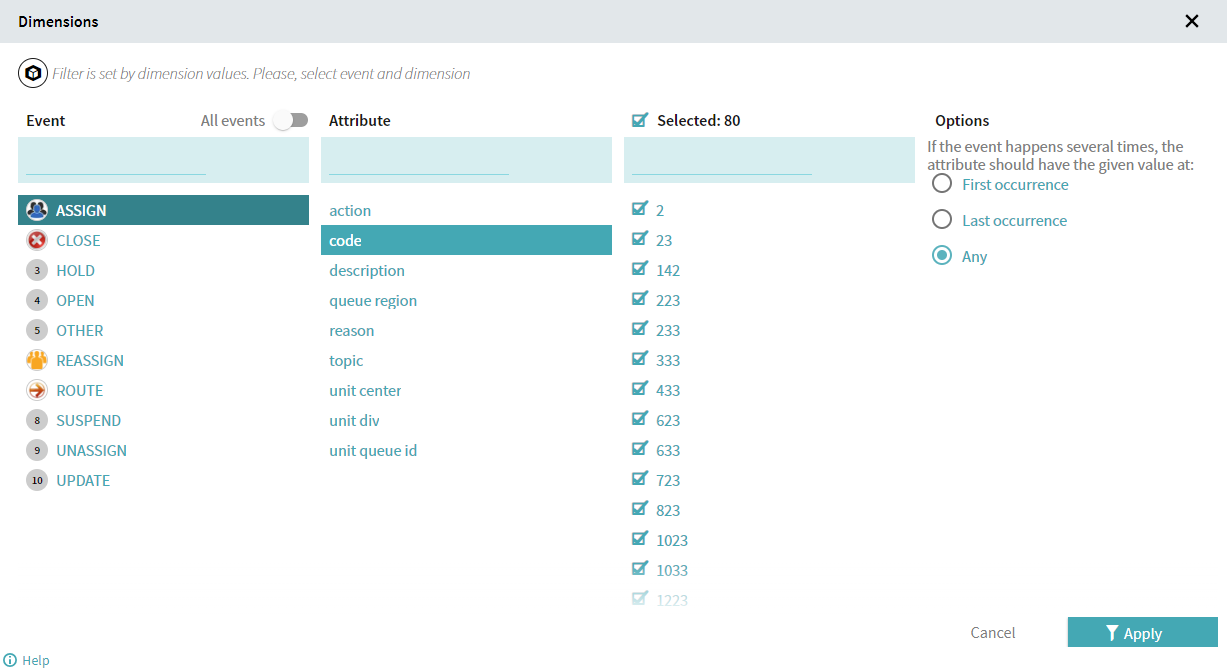
To configure a dimension, you need to select a single Event (or all events from the project), an Attribute belonging to it, and a group of attribute values.
- Click in Filtering tools at the top of the program to open the Dimensions window.
- Click an event name to select Event.
You can toggle on the All events option to consider every Event included in the currently selected timelines. In this case, all further settings will be applied to every event in the project. - Click an attribute name to select Attribute. Only one attribute can be selected, as a dimension is defined by a single attribute per configuration.
- Optionally, select certain Attribute values. All values are selected by default. Unmark respective checkboxes to ignore certain values.
You can also unmark the checkbox near Selected, above the values list, to deselect all attribute values. It can be helpful when you need to select only some attributes from a long list, or vice versa - select all deselected events at once. - In Options, select which occurrence of the event to consider in the statistics, since events can occur more than once in a timeline:
- First occurrence
Only attribute values belonging to the first occurrence of the selected Event per timeline will be considered. - Last occurrence
Only attribute values belonging to the last occurrence of the selected Event per timeline will be considered. - Any
Attribute values belonging to every occurrence of the selected Event per timeline will be considered. - Click Apply to use the configured dimension as a filter.
As a result, a new Filter by Dimensions will appear in the Current block at the top.
Dimensions in other analysis modules and tools
Dimensions are included in several analysis modules and configuration tools, usually for breakdown purposes. You can use Dimensions:
- In Metrics panel
In this expandable metric overview, click a metric histogram to open it in a separate window. There you can add a dimension to see its distribution for the currently selected timelines in descending order.
For details on the panel, see Metrics Panel. - In analysis modules:
- Breakdown
An analysis module based on Dimensions. It allows fragmenting project data by breaking it down based on Dimension values.
For details on the analysis module, see Breakdown. - Interval measurements
Here you can add a dimension to be able to switch the histogram display, making it based on the selected Dimension values.
For details on the analysis module, see Interval Measurements. - Predecessor analysis
Here you can add dimension-based Breakdown by attribute, to include Dimension values into the analysis.
For details on the analysis module, see Predecessor Analysis. - In configuration tools:
- Aggregations
You can add Dimensions to an aggregation configuration.
For details on the tool, see Aggregations. - Charts
Some chart types require adding a dimension in the Breakdown field to be able to display a chart.
For details on the tool, see Charts.
To find out what chart types require Dimensions, and for instructions on how to add dimensions to charts, see How to Configure Chart. - Metrics
The metric types Attribute value and Attribute distinct count require a dimension to be configured.
For details on the tool, see Metrics.
9/5/2024 4:23:54 PM