Timelines
Analytics in Timeline originate from real process instances uploaded to the program. The Timelines analysis module gives the true end-to-end visibility of a process instance and offers case management to evaluate the specific details of a certain case. Process instances can be analyzed in detail even where different steps in the process are performed on multiple back-end systems.
Exploration of a single timeline is beneficial from different perspectives. For example, you search for violations in the business process. In the final filtration, only a few timelines are left. A manual review of each case may accelerate root-cause scanning. If you have plenty of timelines in selection, sort them to see, for instance, those ones, that were processed the last of all.
To navigate to this analysis module, select Timelines in the drop-down list under the project's name.
Workspace
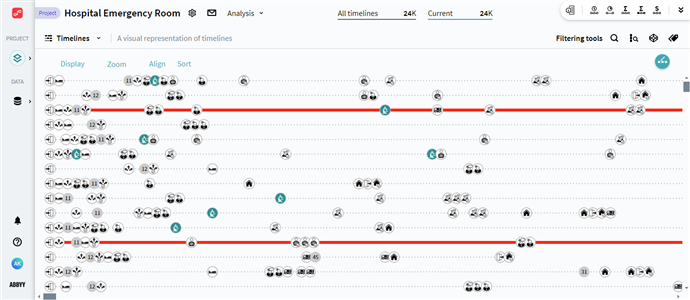
When you open the Timelines analysis, you see all timelines that fit the currently applied filters. Each line represents a single process instance defined in data. Each circle represents an event, and the distance between events proportionally represents duration.

Take a look at Display settings. Click this button at the top and specify how to deal with:
- Duration
Select whether you want to see the proportional duration between events. - Identical events
A timeline can include identical events when the same event appears several times in the series. Choose how to treat them in timelines: Expand to show all events, Collapse to display only the first event from a row.
For more information, see Event status. - Event markers
Choose the size of event circles to display in timelines.
Additionally, use various configurations to zoom, align, and sort timelines. By default, the program sorts entities randomly.
To see the data of an instance, click on a timeline line. For details on a single timeline representation, see Single Timeline View.
Visualization
Timelines overview gains even more from visual representation when you adjust events' style or color timelines using Classifications. By setting up colors or icons for events, timelines become visually readable, as you do not need to guess what stands for this process step. By applying classification, certain timelines are highlighted on the main page of the analysis module by a certain rule. This way, the process of distinguishing groups of timelines of interest gets easier and more convenient.
For details on those configurations, see How to set event style, Classifications.
05.09.2024 16:23:54