Chart Types
Here are listed the types of charts that are available in Timeline. Each type has its own unique configuration options, expand the sections below to learn about them.
Number
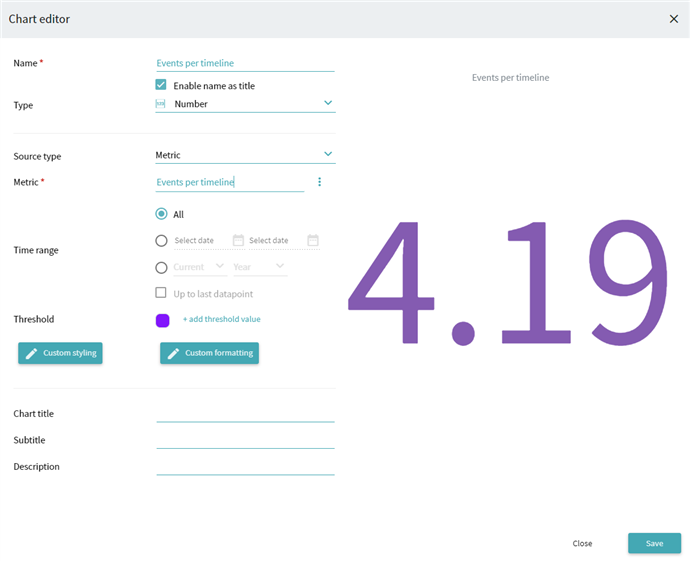
Shows a numeric value of a metric.
- Threshold
Color the number on the chart depending on its value. Specify threshold number to highlight values lower it with the set color. You can add more than one threshold and apply different colors.
For number charts a variety of customization options is available:
- Custom styling
Click it to open a new window with a wide range of font and text alignment settings. Here you can manually set fonts for the number on the chart, define font weight, style, and adjust vertical and horizontal alignment. You can configure the chart's title display as well.
Note. The most common fonts are offered as a list, so you can select one of them. However, you are free to set up a fully custom font by typing its name in the Select font field. Remember that a custom font can be only displayed on systems that have it installed, otherwise users will see the value in a default font. - Custom formatting
Click it to open a new window with number format settings. Here you can set the type of formatting to Number, Duration or Currency. Each of them has further intuitive sub-settings, related to the nature of the format. You can also provide a Formatting template to make the number on the chart meet all your requirements.
Important. The Humanize numbers option is present for every formatting type, it shortens big numbers to a compact, human-readable display. For example, 1000 -> 1K.
While using it, keep in mind that the mathematical reduction rules are applied, which can be critical for Currency format. For example, 1450$ -> 1K$.
Example:
Line chart
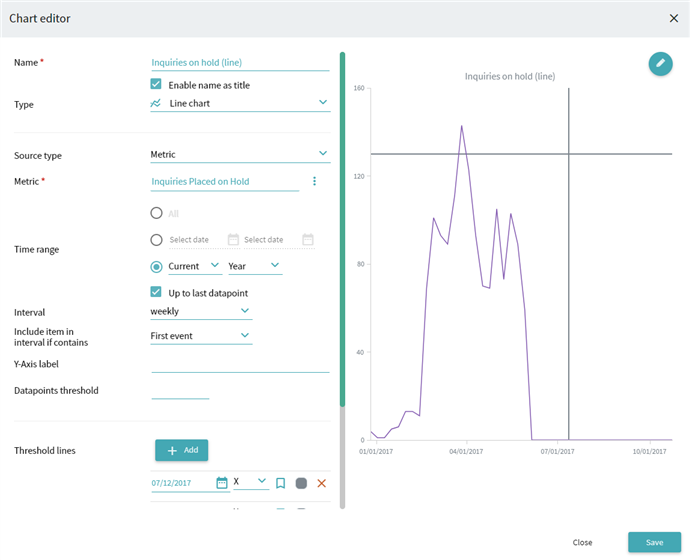
Displays a line graph of the chosen metric's values distribution, with a metric value on the Y-axis and time range on the X-axis.
- Interval
To configure the time step for the X-axis, choose between daily, weekly, monthly, and yearly ranges. - Include item in interval if contains
Display events based on their occurrence in timelines: first, last, or any event.
Note. Unavailable if Aggregations is chosen as the Source type. - Y-Axis label
Specify the axis name to identify the data it represents. - Datapoints threshold
Define the maximum of datapoints shown on the chart. For example, you have 25 items in the metric, but you want to show only 10 on the chart. To do this, add the desired value here. The line graph will display 10 average points instead of 25. - Threshold lines
If needed, add supplementary lines on each axis to visually specify some threshold values on the chart. You can add several lines, color them differently, and add labels for each line. The input type may differ depending on the chosen metric: - Number - enter an integer value, only digits input is supported.
- Date - click
 and select a day in the drop-down calendar, or enter a date in the format mm/dd/yyyy. For example: 03/28/2022.
 - Time - enter time in the format years?:months?:days?:hours:minutes:seconds.
The placeholder text 0:00:00 stands for hours:minutes:seconds, these blocks are mandatory. If you want to specify years or days, make sure to add them to the left. For example:
- 1:07:16:00:00:00 adds a threshold line on the point of 1 year, 7 months, and 16 days.
- 23:00:00:00 adds a threshold line on the point of 23 days.
Note. The entered values are converted according to unit limits. For example, if you enter 25:00:00 (25 hours), then the program will automatically convert it to 1:00:60:00 (1 day and 60 minutes).
Example:
Bar chart
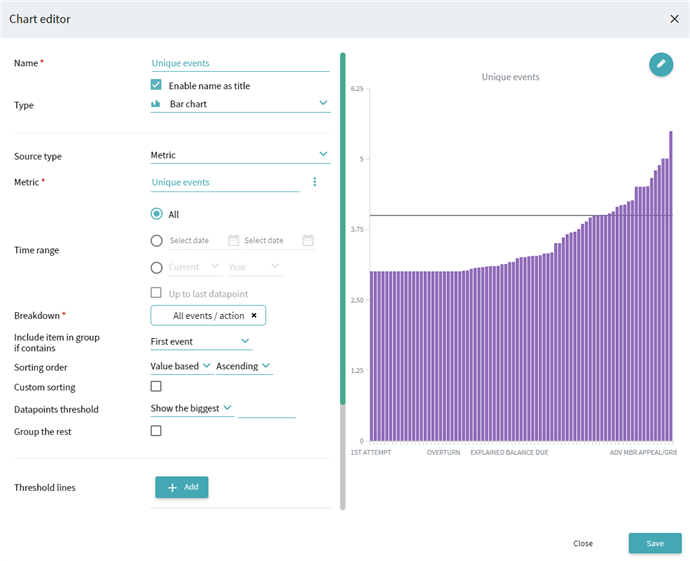
Displays a histogram of the chosen metric's values distribution broken down by Dimensions (pairs of event and attribute), with a metric value on the Y-axis and Dimension value on the X-axis.
- Breakdown
Add a Dimension to form the X-axis. This field is Mandatory.
Important. If Aggregations is chosen as the Source type, only dimensions added to the current aggregations' configurations are available. Make sure to create dimensions in advance in the Aggregations editor. - Include item in group if contains
Display events based on their occurrence in timelines: first, last, or any event.
Note. Unavailable if Aggregations is chosen as the Source type. - Sorting order
Choose how the values will be sorted on the chart: Alphabetical or Value based. The sorting order can be Ascending or Descending.
You can also create a Custom sorting order by marking the respective checkbox. In the appeared list, drag the elements to reach the needed sequence. You can also add new X-axis labels to the sort order. To do it, specify their names and click +add. They will be applied only if corresponding values already exist in the chart. If needed, revert the changes by clicking Reset. You can import or export a custom sorting file in CSV format. - Datapoints threshold
Define the maximum of datapoints shown on the chart. For example, you have 25 timelines in the metric, but you want to show only 10 on the chart. To do this, add the desired value here. There will be 10 average bars displayed on the histogram instead of 25. Choose the Group the rest option to merge the values that do not fit the threshold settings in one bar. - Threshold lines
If needed, add supplementary lines on each axis to visually specify some threshold values on the chart. You can add several lines, color them differently, and add labels for each line. The input type may differ depending on the chosen metric: - Number - enter an integer value, only digits input is supported.
- Date - click
 and select a day in the drop-down calendar, or enter a date in the format mm/dd/yyyy. For example: 03/28/2022.
 - Time - enter time in the format years?:months?:days?:hours:minutes:seconds.
The placeholder text 0:00:00 stands for hours:minutes:seconds, these blocks are mandatory. If you want to specify years or days, make sure to add them to the left. For example:
- 1:07:16:00:00:00 adds a threshold line on the point of 1 year, 7 months, and 16 days.
- 23:00:00:00 adds a threshold line on the point of 23 days.
Note. The entered values are converted according to unit limits. For example, if you enter 25:00:00 (25 hours), then the program will automatically convert it to 1:00:60:00 (1 day and 60 minutes).
Example:
Pie chart
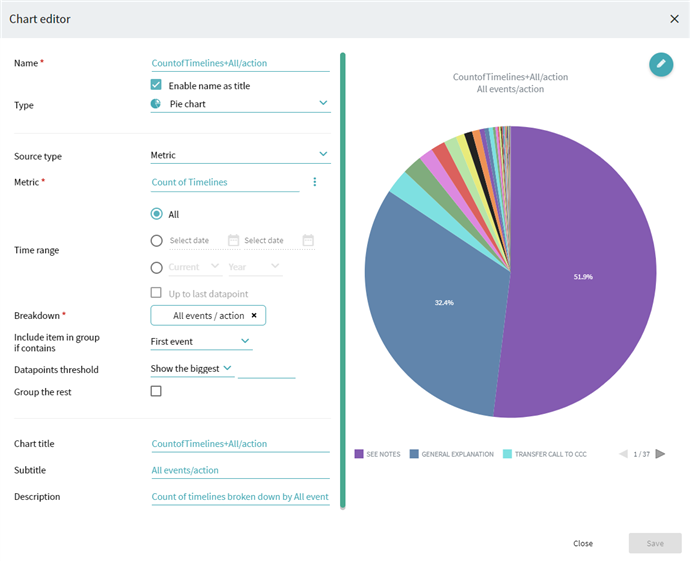
Displays a circular diagram of a metric broken down by Dimensions. The entire pie is 100 percent of a metric value, and its slices represent chosen dimensions.
- Breakdown
Add a Dimension to form the X-axis. This field is Mandatory.
Important. If Aggregations is chosen as the Source type, only dimensions added to the current aggregations configurations are available. Make sure to create dimensions in advance in the Aggregations editor. - Include item in group if contains
Display events based on their occurrence in timelines: first, last, or any event.
Note. Unavailable if Aggregations is chosen as the Source type. - Datapoints threshold
Define the maximum of datapoints shown on the chart. For example, you have 25 timelines in the metric, but you want to show only 10 on the chart. To do this, add the desired value here. There will be 10 average pie slices displayed on the diagram instead of 25. Choose the Group the rest option to merge the values that do not fit the threshold settings in one slice.
Example:
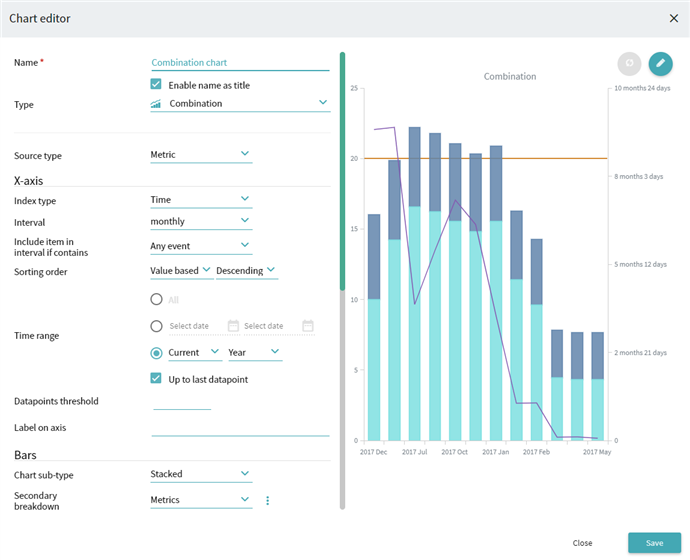
Combination
Allows displaying both Line chart and Bar chart based on different metrics in one view for comparison.
X-axis
| Options | Description and configuration | |
|---|---|---|
| Index type | Define the values shown on the axis. | |
| Time | Choose Interval from daily to monthly. Choose the Include item in interval if contains option to display events based on their occurrence in timelines: first, last, or any event. Specify Sorting order: Alphabetical or Value based. The sorting order can be Ascending or Descending. Set Time range (see step 7). | |
| Dimension | Add a dimension as a Breakdown. Choose the Include item in group if contains option to display events based on their occurrence in timelines: first, last, or any event. Specify the Sorting order as for Time, or create a Custom sorting order by marking the respective checkbox. | |
| Datapoints threshold | Define the maximum of datapoints shown on the chart. For example, you have 25 timelines in the metric, but you want to show only 10 on the chart. To do this, add the desired value here. There will be 10 average bars and line points displayed on the diagram instead of 25. | |
| Label on axis | Specify the axis name to identify the data it represents. | |
Bars
| Options | Description and configuration | ||
|---|---|---|---|
| Chart sub-type | Define additional parameters for the histogram. | ||
| None | No bar histogram is displayed on this chart. | ||
| Single | Base the histogram on one metric. |
Metric name Specify a metric to base the histogram on. |
|
| Stacked | Base the histogram on several metrics with proportions specified on bars. |
Secondary breakdown:
|
|
| Grouped | Base the histogram on several metrics with side-by-side bars. | ||
| Label on axis | Specify the axis name to identify the data it represents. | ||
Lines
| Options | Description and configuration | ||
|---|---|---|---|
| Chart sub-type | Define additional parameters for the line graph. | ||
| None | No line graph is displayed on this chart. | ||
| Single | Base the line graph on one metric. |
Metric name Specify a metric to base the line graph on. |
|
| Multiple | Base the line graph on several metrics. |
Secondary breakdown:
|
|
| Label on axis | Specify the axis name to identify the data it represents. | ||
| Threshold lines | If needed, add supplementary lines on each axis to visually specify some threshold values on the chart. You can add several lines, color them differently, and add labels for each line. |
The input type may differ depending on the chosen metric:
|
|
Example:
9/5/2024 4:23:54 PM