Side-by-Side Comparison
Overview
Some analysis tasks may require a comparison of metrics in different timeline sets. Side-by-side comparison is an analysis module that helps to assess the difference of metric values in two timeline sets placing these values next to each other. This module is perfectly adjustable to your analysis objectives. It is based on your currently selected set compared with any other one, existing in your project. The second set is selectable from a list, so you can switch them at any time you need. The set of metrics is also configurable, add or remove your custom metrics along with the standard ones, which are counted by the program upon data upload. The comparison mechanism is flexible enough to provide every opportunity to perform the most complex analysis tasks. Side-by-side comparison is complemented with additional histograms to make the comparison more illustrative.
This module is responsive to your needs, you can find numerous scenarios in which such comparison will be helpful. You may want to measure the results of administrative changes made in the process, compare the progress of different working shifts or teams working simultaneously, etc.
To use this analysis module, select Side-by-Side Comparison in the drop-down list under the project's name.
Side-by-side comparison window example:
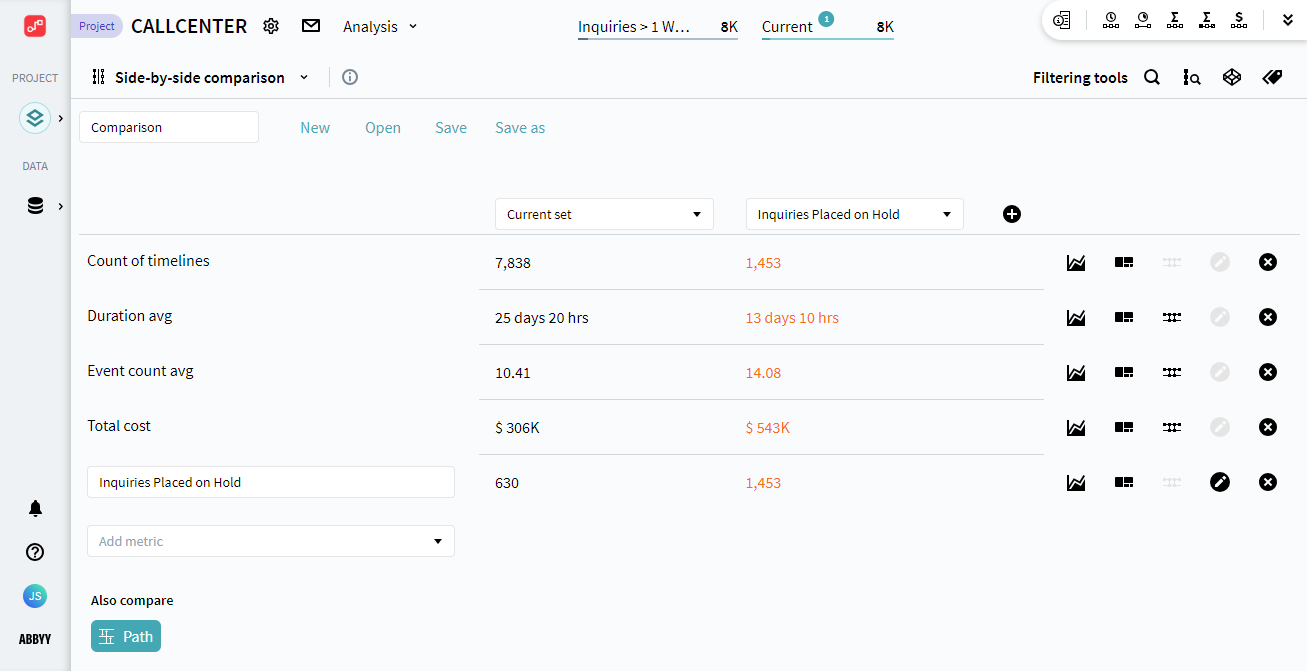
What to compare and how to compare it
In this analysis module, there are two timeline sets available for comparison by placing them side-by-side. The first set is always the current one the second one is All timelines by default. You can change the second set by clicking All timelines and selecting any other existing from the appeared list.
You may want to create a completely new timeline set that will meet the needs of your analysis task for further comparison. For the instructions on how to create a new set, see Timeline Sets.
For the compared sets, the following metrics are available:
- A default list containing metrics which the program calculates in accordance with the currently applied filters. The list includes the following metrics: Count of timelines, Duration avg, Event count avg, Total cost.
Important. Any metric can be removed from the list, including the ones displayed by default. However, only custom metrics can be added manually, so in order to display a removed default metric again, you will have to create a new comparison. - All existing custom metrics, that a user created manually In the Metrics tool. You can select existing metrics from the Add metric drop-down. To be able to add a metric to the comparison, you need to create it beforehand. To learn how to create a metric, see How to configure a Metric.
After adding custom metrics to the list, you can edit their names and settings directly from this module by clicking . The Metric editor window will open.
The metric values for both sets are shown next to each other making it easy to compare them. You can configure the list of metrics included in the comparison according to your needs by adding suitable ones. You can also remove any metric from the list by clicking  .
.
You can save your configured comparisons in order not to rebuild them manually again. Provide a name to the comparison to save it.
Use case
Additional tools
Side-by-Side comparison offers some auxiliary tools to visualize compared metrics in histograms. Each metric entry has a separate set of buttons opening the histograms related to it.
Note. Some histograms may be not compatible with certain metric types depending on their settings. In these cases, a button related to such a histogram will be missing.
The following histograms are available:
 - Compare metric history
It is a line chart where lines represent the metric values in the sets selected for comparison.
Here you can configure the following settings:
- Select interval - to adjust the time frame displayed.
- Include item in interval if contains - to select what events to consider when building lines, all of them, or only the first or the last ones.
 - Compare breakdown
Bar chart where bars represent the metric values in the sets selected for comparison. Bars are counted based on the attribute selected as a dimension.
Here you can configure the following settings:
- Pair of Event and Attribute (dimension) - to set up the main breakdown element.
- Include item in group if contains - to select what events to consider when building bars, all of them, or only the first or the last ones.
- Sort by - to define the sorting of bars on the chart. An order of metric values that you can prioritize by current set, comparison set, or the value of the selected dimension.
- Truncate labels - to collapse parts of very long attribute names for better display.
 - Impact analysis
A chart that displays an axis with the range of metric values on which are placed average values from both compared sets, represented by bubbles. These bubbles are supplemented with line segments that show the range of metric values in the corresponding set. This histogram can be exported in PNG format.
Here you can configure the following settings:
- Deviation - 75th percentiles, 90th percentiles, standard deviation.
Side by Side Comparison and Path analysis
These two analysis modules have connections:
- Side-by-Side comparison appears in Path analysis as a built-in tool in Path details.
For details on paths, see Path Analysis. - Path analysis also offers a Compare functionality that allows discovering metric values in different timeline sets distributed by paths. For this reason, Side-by-Side comparison has a shortcut to the Path analysis module enabling instant redirection.
For details on comparison abilities of Path analysis, see Comparison of paths in different sets.
05.09.2024 16:23:54