Simulation
Overview
Simulation provides an opportunity to test a variety of process optimizations without a solution implementation. The feature allows you to experiment with process performance by altering the number of transactions initiated per unit of time, varying processing times, or available resources. You can easily check how significant changes (for example, resource distribution) affect the processes and estimate the potential benefits of choosing a particular solution. Create multiple scenarios to find the approach that suits you most. Compare results, find the most effective scenario, and proceed with solution implementation in the real processes.
For example, while exploring your processes, in Milestone view you can see that the mandatory event "Approval" causes a bottleneck. Try to resolve this issue using the Simulation module. Take the already created schema for this process as a basis for a future simulation scenario. Mine behavior from the uploaded data and alter the time that can be spent on this process step. Run the simulation and compare results to the real processes. You will see how potential changes improve your process workflow in terms of time and money. Based on the analysis results, create a solution for your business and implement it in processes.
To use this analysis module, select Simulation in the drop-down list under the project's name.
Basic workflow steps
- Prepare a milestone schema. Optionally, you can filter timelines in advance.
It is important to create a milestone schema in Milestone view. In addition, you can filter timelines to form a process you want to explore.
For details about simulation prerequisites, see the Before You Begin section.
For details on the schema creation and configuration, see How to create Milestone schema.
For more information about timelines filtration, see Filtering Tools, Filters, and Sets. - Select the schema for the simulation scenario and mine the process behavior.
The program builds the process model based on the chosen schema and filtered timelines. Timeline extracts the real process behavior and shows its statistics. It represents values for fork distributions, the processing time, and the start time distribution of timelines. Such a digital footprint becomes a starting point for future simulation. - Configure a simulation scenario.
Change fork distributions, modify the processing time, and reallocate resources between different events.
For details, see How to Configure Simulation Scenario. - Run Simulation and analyze results.
Evaluate how the configured scenario affects the process. The program displays results for simulated timelines according to the scenario as if they happened.
For details, see Run Simulation and Proceed with Results.
Workspace
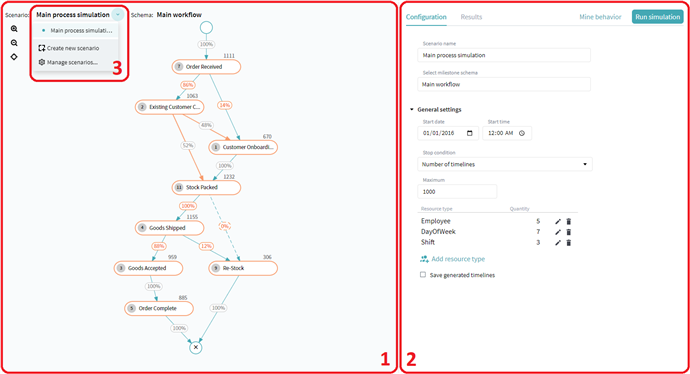
In the Simulation feature, the main workspace includes a Schema with the visualization of a simulation scenario and a functional panel with available settings and simulation results. You can adjust the size of each side by dragging the line between them.

Learn more details on the workspace sections from the list below. Numbers in the list correspond to those on the picture:
- The Schema displays the selected event workflow with configured fork distributions. If you modify nodes and transitions when configuring a scenario, then these elements are marked orange.
- The functional panel of the Simulation analysis tool, that includes:
- The Configuration tab with the simulation scenario settings and rules.
- The Results tab with generated statistics that become available after you configure and run a simulation scenario.
- The Node pane with information and settings, that appear when you click any part of the schema.
Note. Node default statistics are calculated and displayed after you click the Mine behavior button. - The scenario management pane, which allows switching between scenarios, adding a new one, or managing the existing scenarios.
05.09.2024 16:23:54