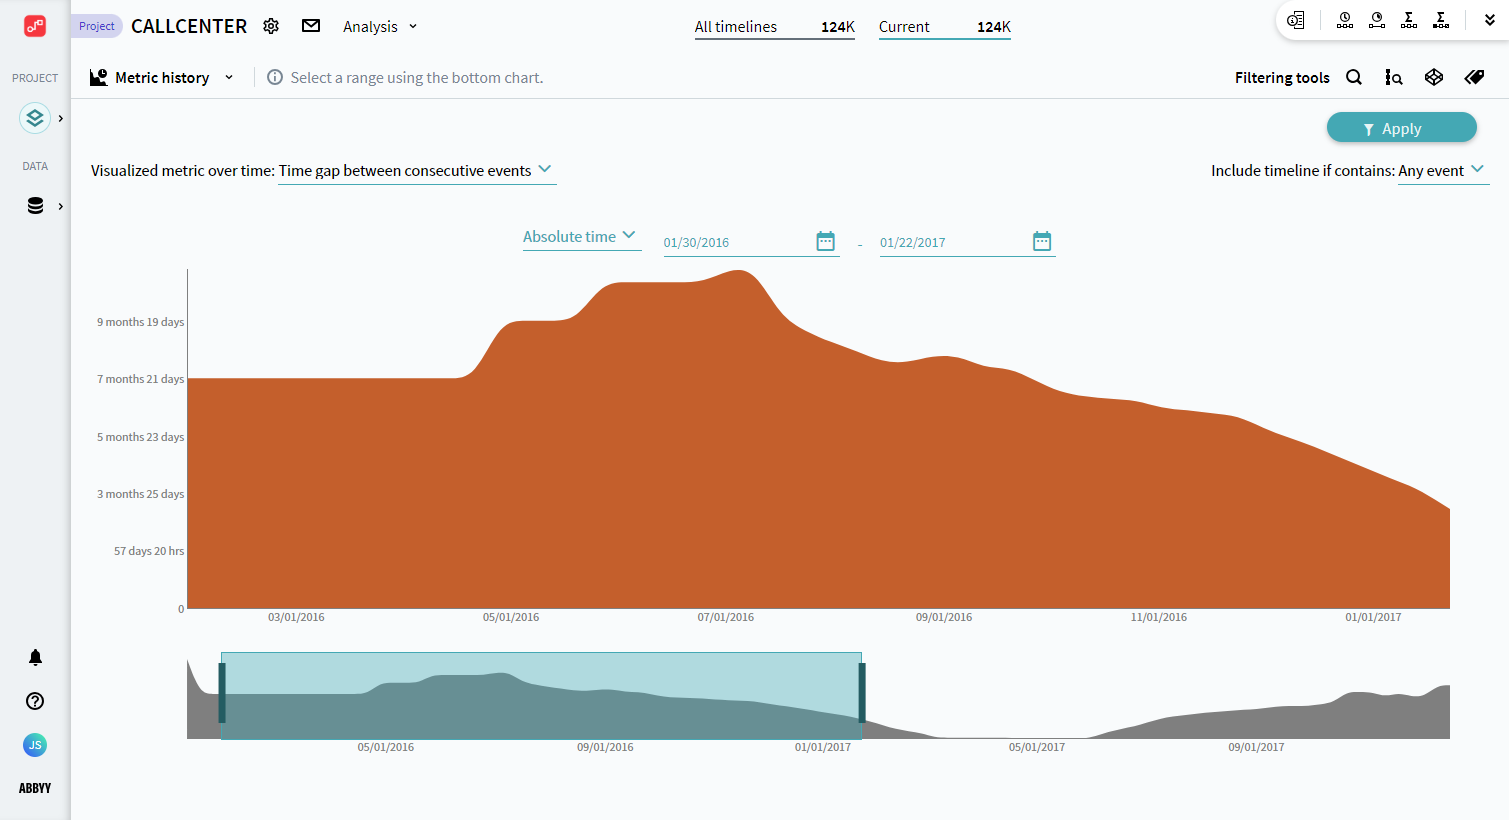
Metric History
Metric history allows visualizing metric values and the dynamics of their change over time. Analyzing a general view of how a metric modifies over the course of a project, you gain an opportunity to spot deviations or outstanding values for certain time gaps. Relying on the results, build the base for future explorations or pick timelines from a certain time range for further analysis.
To use this analysis module, select Metric history in the drop-down list under the project's name.
Before you begin
When you work with Metric history, the process statistic is shown for the currently applied filters. You can find them at the top of the program in the Current section. It allows applying analysis configuration to the preselected timelines and sets. For details, see Effects of Current filters.
In addition, the Calendar settings affect the statistic calculated while working with Metric history. For details, see Effects of Applying Calendar.
Workspace
Metric history generally serves as a module for information review. When you open the analysis module for the first time, it shows the Count of timelines metric where the starting timeline event falls in the defined time range. You see all timelines on the histogram as the whole lifetime of the project is selected.
Metric history includes:
- Configuration pane at the top.
Here you define what information you want to explore. For more details, see the Configuration section below. - The histogram in the center displays values distribution over the selected period.
The program shows time period in focus on the X-axis and metric values on the Y-axis. - The bottom chart with overall statistics.
The X-axis always starts from the earliest timestamps that appeared in timelines and ends with the latest. Metric values are distributed maintaining the scale of relation to each other.
Configuration
Interaction with Metric history consists of selecting metrics of interest and specifying time period:
- Select a metric to display from the drop-down list.
Some metrics may require additional settings. Refer to Metric types to learn more. -
Specify timelines to include.
- Set up a time gap to explore. Use one of the options:
- Manually specify a certain period of time by selecting dates in Absolute time or Last period.
- Change borders on the bottom overview histogram to focus on a more specific time frame that contains data of interest.
After configuring the analysis module and selecting the time frame, click Apply to create a filter and drill in on those specific timelines using other tools and analysis modules.
Metric types
To build a histogram, Metric history uses predefined metrics.
Learn more about metric types from the Visualized metric over time dropdown list.
05.09.2024 16:23:54