Path Analysis
Overview
The Path analysis tool is used to identify the process patterns by displaying the most commonly occurring paths in a swimlane-like form. Paths show exactly how the process was completed based on the events selected. With the help of this tool, you can explicitly see variations of the event sequence and determine workflow issues like where steps are being skipped, reoccurring, or ordered not as expected.
For example, you come across unexpected delays in your process, and you need to find their causes. With Path analysis, you can display the Top 50 paths with the longest duration, take a closer look at the most frequent ones, and see if there are several constantly repeating steps or looping transitions that affect the overall performance. After that, you may want to apply these problematic paths as a filter to the current timeline set for further analysis with the help of other Timeline tools.
To use this analysis module, select Path Analysis in the drop-down list under the project's name.
Path analysis window example:
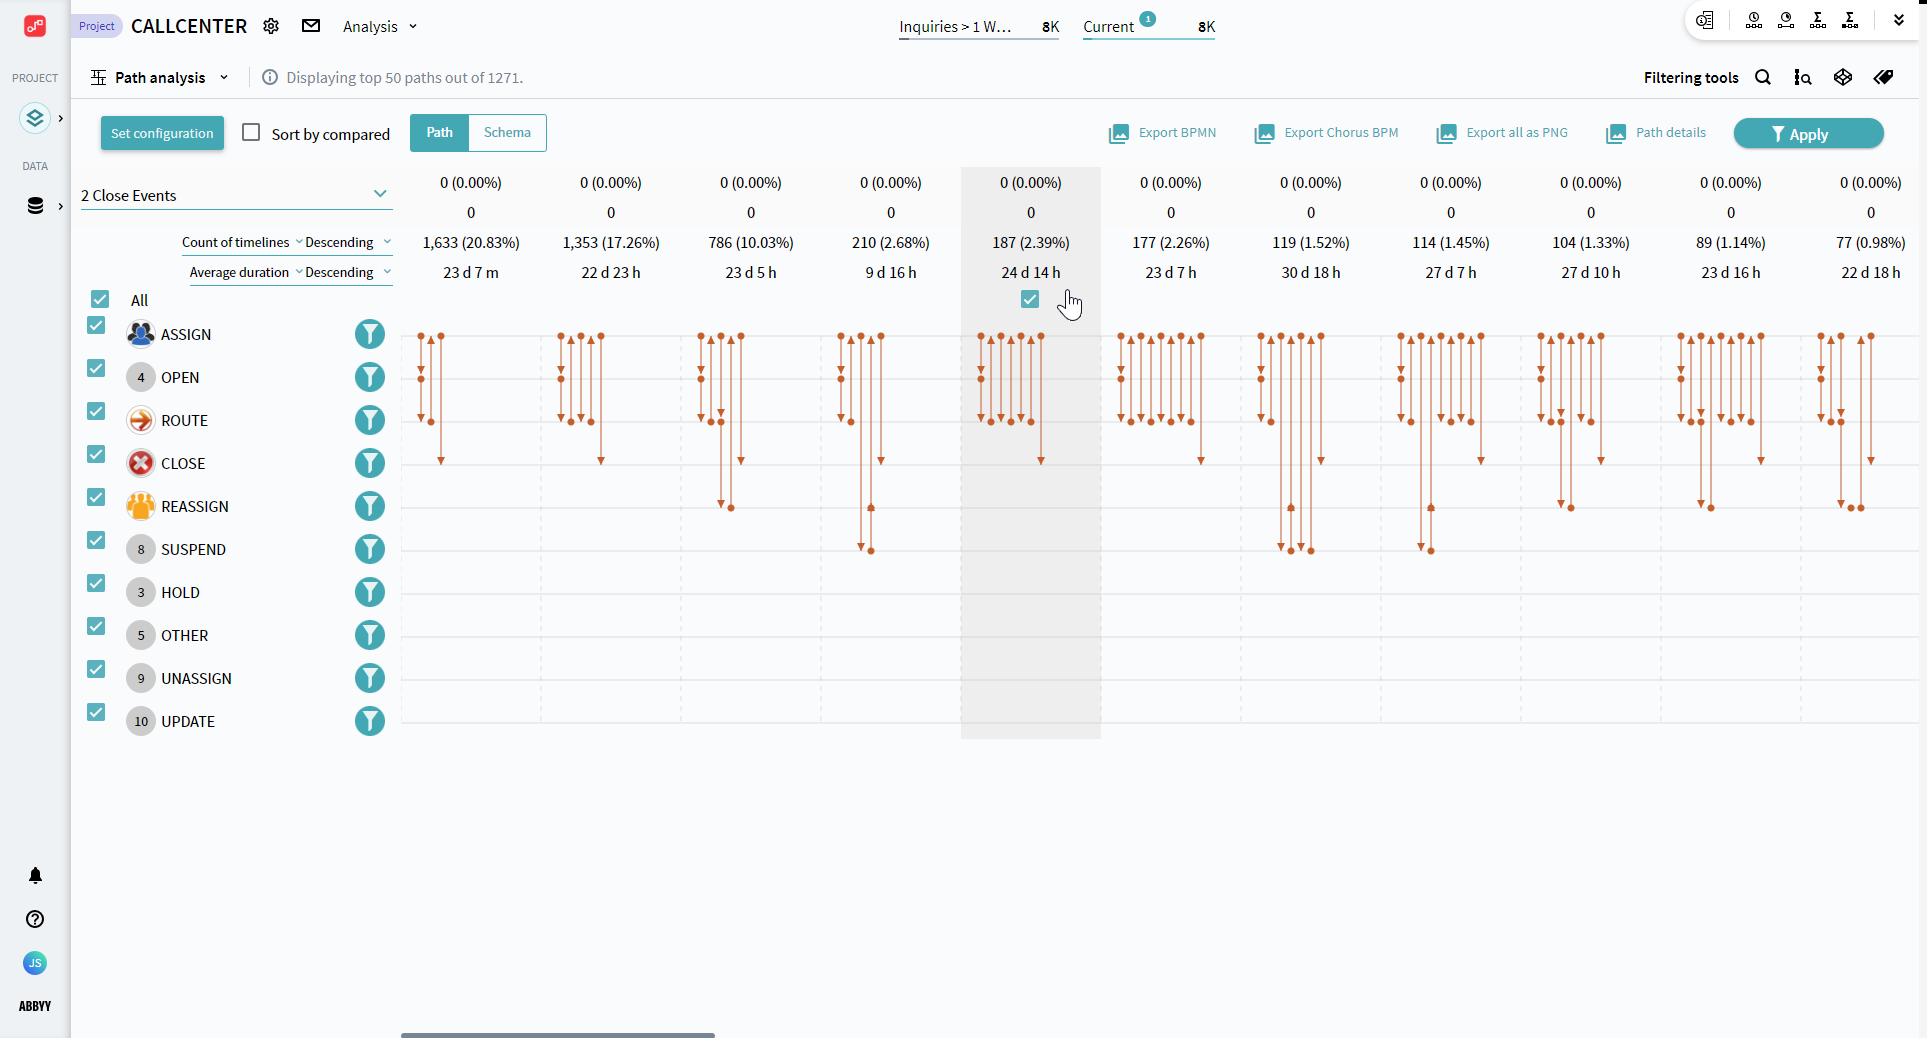
When first opened, Path analysis shows a default representation of the top 50 most frequent paths in your current timeline set. The tool suggests the path steps (events) along the left with the check mark, but you can change what events should be included at any time. As you add or remove events in the process the application dynamically recalculates the processes’ percentages of frequency shown above paths. The paths are ordered by your choice, either from the most to the least frequently occurring, or from the least to the most frequent ones, going from left to right.
Path analysis consists of two representations that you can switch between – Path and Schema.
- Path is transition focused.
It provides you with a more linear view of the process and access to where steps are being repeated, skipped, ordered incorrectly, etc. - Schema is event focused.
It allows you to see the event names to find out their order, which of them occur at the same time, and how they are interconnected with transitions within a particular path.
Both representations provide side-by-side analysis capability and can be compared by different metrics.
Path analysis default display
When first opened, Path analysis displays a Paths representation built on default settings. They look as follows:
- Set
Paths are always based on the current timeline set. It means that all the filters applied to the set are reflected in the path structure. - Events
- The 15 most frequent events occurring in the current timeline set are considered and displayed in paths.
Note. Though you can display all the events that exist in your project in the Path analysis module, only the 15 most frequent ones are considered when building Paths. - Identical or reoccurring events are displayed on Paths. This setting also impacts Schema representation.
- Event names are not shown in Paths, but this setting impacts the names' display on Schema. By default, event names are displayed in Schema representation.
- Metrics
Paths are based on the first selected metric, which is considered the main one. By default, it is Count of timelines. It is possible to add an auxiliary metric, but it is empty in the default configuration. - Sorting
Sorting is based on the main metric. The default sorting order is Descending. Together with the Count of timelines metric you have the Top 1 path as the most frequent one in the current set.
For more information about sorting options available in Path analysis, see Sort order.
As a result of these settings, you can already do a first-glance analysis of the timelines paths in the process. You see the Top 50 most frequent process flow patterns in timelines, included in the current set. This allows you to check if there are any irregularities, such as a big number of repeating events, back-and-forth transitions, or skipping of some essential steps. Switching to the Schema representation, you can observe the same paths in a more illustrative manner. It gives an understanding of what events exactly are involved in these irregularities and what the process image looks like based on this or that path.
The more irregularities appear in the most common paths, the more they affect the overall process performance.
You can alter the path conditions, display settings, and perform a much deeper analysis of your process patterns with the help of Path analysis. To learn more about the possibilities this module offers, see Dealing With Path Analysis.
Path analysis and Primary path
Path analysis is the groundwork for Primary path view since it takes the Top 1 Path as primary and the rest as deviations. Overlaying the paths one on other results in the Primary path graph.
Path analysis shows you the most common patterns of the process flow separately, which allows for analyzing different Paths and their details. At the same time, Primary path view combines consecutive paths into one pattern to create a wider process sample.
For details on the analysis module, see Primary path view.
05.09.2024 16:23:54