Single Timeline View
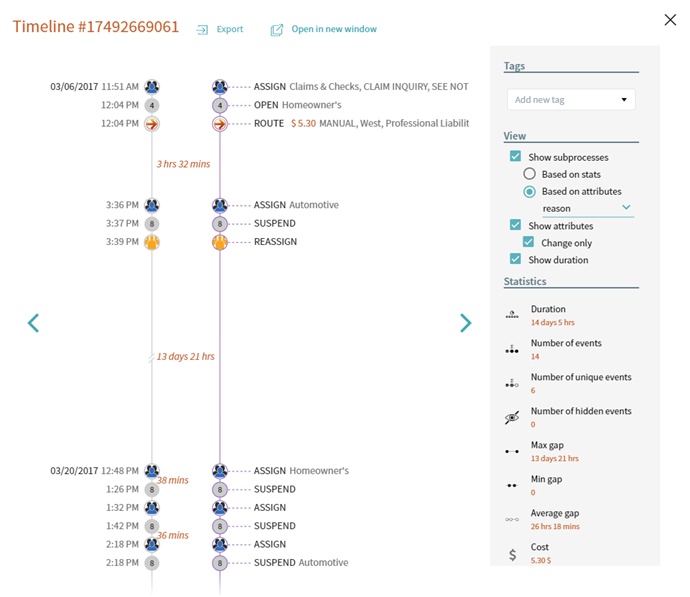
To see the data of an process instance, click on a timeline line in the Timelines analysis window. The appeared window shows details of a specific Timeline #X, which represents a singular instance. This is a representation where a timeline can be analyzed thoroughly. Use arrows to switch between instances. To fixate a particular timeline, open these details in the new browser tab by clicking Open in the new window at the top.

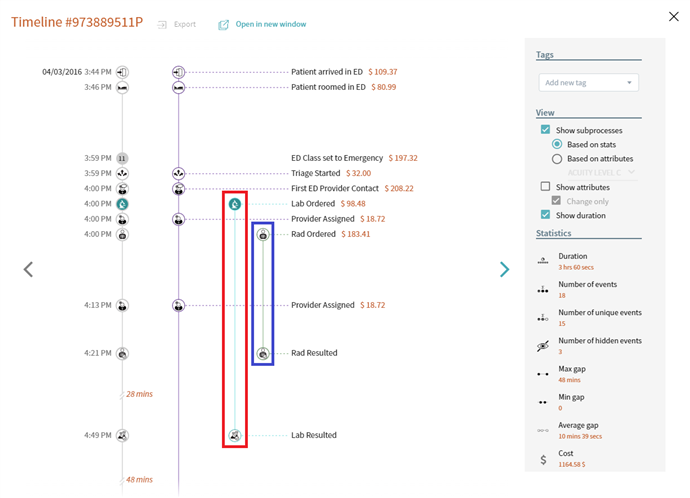
The column on the left is a consequence of all events occurred with this specific process. Each event is supplied with belonging attributes and date when it starts. Time gaps between events are proportional to their real duration. For long gaps, you will see the exact duration on a line.
If you specify cost configuration and business duration, corresponding values display in this window too. For details on how to set up metrics, see Costs Configuration, Calendar. Also, check Effects of Applying Calendar to see, how it influences the timeline representation.
You can easily share single timelines with others interested in the particular process flow. To do it, open it in a new window and send its link to a person. Otherwise, save the timeline, its events and corresponding attributes as a CSV file by selecting Export at the top.
Configuration
When reviewing a timeline instance, use the View section on the right to adjust its representation:
- Show subprocesses
A subprocess is a potential workflow that can be extracted from a timeline. Select whether or not you want to see them broken out together either relying on stats or attributes.
- Based on attributes
For this option, select an attribute from the drop-down list below. This way a subprocess includes events that have the same attribute value.
For example, a timeline includes information about shifts. If you organize subprocesses relying on this attribute, each subprocesses will include events belonging to the same shift.
- Based on stats
Subprocesses are calculated automatically based on all timelines statistics. The program checks the frequency of events happening together and results them in a subprocess. If events occur in conjunction at least in 90% of cases when appear in timelines, then the program treats them as subprocess.Example
- Show attributes
Select whether or not to display event attributes. Choose Change only to display an attribute value only when it differs from the previous one. - Show duration
The option allows seeing the duration between the events in the timeline visualization or only seeing how the events were executed in order.
Timeline statistics
Supporting the detailed events description and data, the Statistics section is available on the right. Here the overall timeline information is shown. Find the description of each statistic below:
| Statistic | Description |
|---|---|
| Duration | Shows the overall duration of a timeline. |
| Number of events | Shows the number of all events in a timeline. |
| Number of unique events | Shows the number of distinct events per timeline. |
| Number of hidden events | Show the number of events that were excluded from a timeline. This way they do not influence the statistics. If you use the Collapse strategy for showing identical events, then you see the number of hidden once. |
| Max/Min/Average gap | Shows the maximum/minimum/average time between two adjacent events in a timeline. |
| Cost | Displays the cost of a timeline. The Cost metric appears when you configure a cost at least for one event in Cost configuration. Only events with configured costs are calculated. |
Timeline tags
When you find a timeline that captures attention, add a tag to quickly retrieve it when needed. In the Tags field, select an existing tag or type a name for a new one and press Enter. For details, see Tags.
9/5/2024 4:23:54 PM
