Paths and timeline set filtering
Paths are built on the timelines included in the current set with all filters applied. You can work with this Path analysis from two perspectives or combine them if needed:
- You may want to prepare the timeline set first, according to your analysis objectives. This means filtering a certain range of timeline conditions that forms patterns in single or multiple sets, in which you are most interested. It will help you to find unwanted patterns in certain aspects of the process.
- You can start with finding patterns that require a deeper examination, then filter the current set by paths included in this pattern. After this, use the resulting timeline set for further analysis with the help of other analysis modules.
When the timeline set is prepared, you can adjust some more Path analysis settings, so the visual part meets your needs.
Path analysis settings
Before analyzing paths, you may want to enable some additional options and configure the path display.
Set configuration
This button offers additional settings that you may choose to turn on. They will help you to choose events to consider, configure the display aspects of both Path and Schema representations, and enable the comparison functionality.
Set configuration options
Clicking this button opens a new window with the following options:
- Click Set events to select events from the opened list to consider in Path analysis
Click Default events in the Set configuration window to restore the selection of all events occurring in timelines.
- Select Collapse identical events to hide from paths the events that have transitions to themselves. If this option is not selected, such events are shown as one.
- Select Show compare to enable an auxiliary metric row with a drop-down list of saved sets to compare with the current one. It also enables the Sort by compared option, which allows using the compared set as the base for sorting.
- Select Display names on schema to show the event names in the Schema representation. If this option is not selected, nodes are represented only by icons.
Sort order
Paths are sorted based on the first selected metric, which is considered the main one. Paths analysis offers two basic sorting options:
- Ascending - metrics' values increase from left to right.
- Descending - metrics' values decrease from left to right.
Note. Since you can add a second metric to the path configuration, each metric can have its own sort order, which widens the range of analysis possibilities.
When the Count of timelines metric is selected with the Descending sort order, Top 1 contains the path that most timelines follow. It makes this path the most common one in the analyzed process. This configuration underlies the analysis module called Primary path view.
For details on this analysis module, see Primary path view.
Comparison of paths in different sets
This feature allows you to move from a general analytical approach to the comparative one. You can compare metric values for different sets. To do this:
1. Enable Show compare in the Set configuration window.
2. Select a set from the Compare to set list.
You can also enable Sort by compared to apply the selected sort order to the comparison set instead of the current one.
For example, you can analyze the cost and processing time of processes in a separate branch, look at the paths involved, and then compare these indicators with the main office right in this analysis module.
With the help of all the above, you can configure the Path analysis module to meet the needs of your task before proceeding with the analysis.
Export
Having configured your Path analysis display, you may want to export it as a separate file. PNG format is available by default. Other export formats availability depends on your subscription plan.
Path analysis example
Path analysis offers a number of possibilities to take a very close look at certain process patterns, compare them, examine path details, and filter timelines by paths. Get familiar with the module functionality with the help of the usage example below.
Usage example
As a call center manager, you receive a lot of complaints about long request processing. You want to analyze the most frequent patterns in the work of the call center and find out if there are unexpected delays in call handling or if calls are switched too frequently between operators. Path analysis will help you to find such issues and prepare the ground to find their causes. You may proceed as follows:
- Adjust Path analysis settings to prepare for your research objectives:
- Select Count of timelines as the primary metric to be able to determine the frequency distribution of timelines.
- Select Average duration as a secondary metric as it will help to address the customers' complaints.
- Set Descending sort order for both metrics so the Top 1 path represents the most frequent pattern in the process along with its average duration.
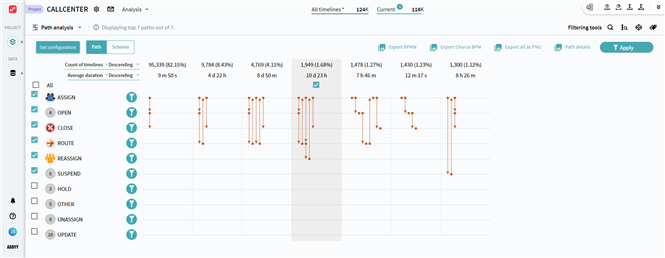
- Take the first look at the paths. Select the most significant ones by clicking them. For example, only those that contain more than 1% of all timelines in the current set. The rest of the paths can be regarded as low-impact elements that do not influence the analysis in this case.
- Hide events that are not involved to simplify the display. You can as well cancel them in Set configuration > Set events to not include in analysis at all. The resulting window may look as follows:

- Examine swimlanes. You may want to pay attention to the following two factors:
- Dots next to each other mean repeating the same event, transitions from it go back to itself. Numerous repetitions can indicate that the process is stuck in some steps.
- Constant transitions between 2 events highlight a loop in the process that can significantly increase the processing duration.
- Examine metric values, you may want to take a closer look at the longest paths. Generally, they are the most complex ones at the same time, which is caused by the possible factors from the previous step.
- Discover problematic paths with Path details. It has the functionality of the Side by side comparison analysis module and allows you to compare the selected path metrics with the current set ones, including your custom metrics. In addition, here you can compare Metric history, Breakdown, and see the impact on the process.
For details on the analysis module and its options, see Side by side comparison.
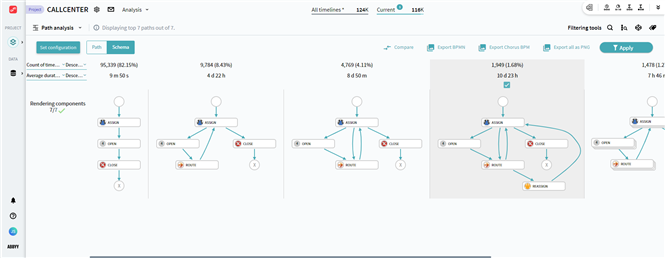
- You may want to switch to the Schema representation to get a more vivid image of the process structure for each of the selected paths. For the given example, it will look as follows:

- At this step, you can already have an understanding of what parts of the process are leading to the reported issue and you can also determine some decision points. Find out the reasons for the existing issues with the help of other analysis modules. You may want to use the problematic paths as filters for the current set for a more detailed analysis. To do this, select a path and click Apply in the upper right corner.
- You have another possibility to determine the impact of the problematic paths. Enable Compare in Set configuration. This will allow you to set them side by side with a timeline set based on the paths that are considered to have a proper structure. See how frequently the problematic ones are followed amongst other paths. The higher the frequency, the greater the impact.
The suggested steps allow you to see if the reported issue is caused by irregularities in your internal process, or if the procedure is followed in the right way, but the customers are still unhappy. This may require a redistribution of the resources involved. You can experiment with resources and the process flow in the Simulation module.
For details on this analysis module, see Simulation.

