タイムレンジ
概要
タイムレンジ分析モジュールはあなたのビジネスプロセスの健全性の全体を提供します。ビジネスプロセスにおけるあなたのイベントの順序、残高、拡張、重複または隔離の概要を把握できるようにします。このモジュールはタイムラインの開始に関連しているイベント発生のタイムレンジを表示します。
これは各種のシナリオの中で役に立つ汎用ツールです。例えば、違反を露出してビジネスプロセスの特定部分を調査するためにすべてのイベントの順序を比較します。
この分析モジュールを開けるには、プロジェクト名の下にあるドロップダウンリストからタイムレンジを選択します。
ワークスペース
タイムレンジのダイアグラムは、初期構成を必要とせず、現在有効になっているイベントと適用されているフィルタリングに合わせて現れます。タイムレンジは、イベントの中央値/平均の発生時間に基づきイベントを並べます。例えば、上部の最初の平均発生イベントは、他のイベントより冒頭の近くにタイムラインで現れます。
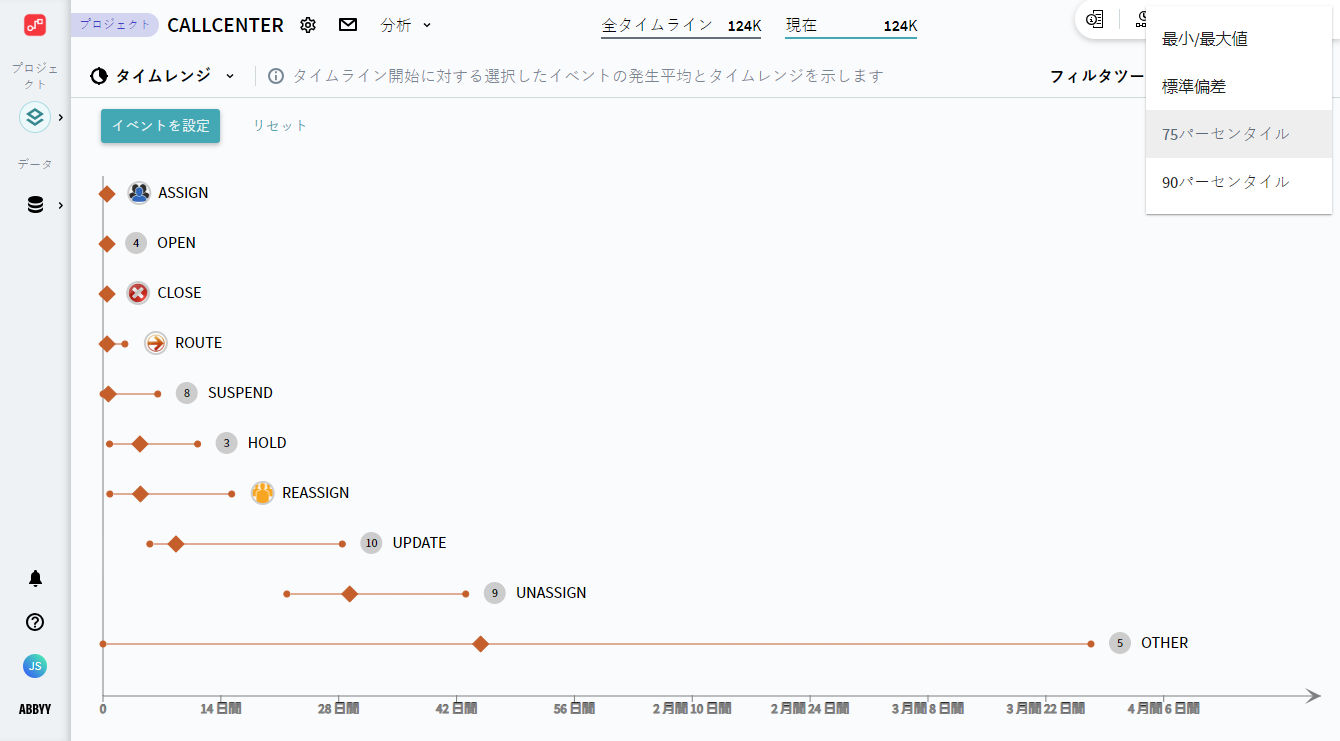
ワークスペースのセクションの詳細については、以下のリストをご覧ください。
- X軸
タイムラインの開始に関連してイベント発生の時間を表すスケールです。 - イベントのセグメント
選択されているイベントのすべての発生は、最も早いイベント発生から最新のイベント発生の順で、タイムスケールに合わせて縦に並べられた線分を形成します。イベントの線にマウスを合わせたら具体的な統計をご覧になれます。線分の順序は、上から下まで、イベントの中央値/平均の発生時間に基づきます。 - 情報のオプション
選択された統計情報はイベントのセグメント値と境界を決定します。
設定方法
タイムレンジのダイアグラムは、現在有効になっているイベントと適用されているフィルタリングに合わせて現れます。イベントや統計情報のオプションを構成したら、ダイアグラムを必要に応じて調整します。
- ダイアグラム上で表示されるイベントを選択します。
左上にあるイベントを設定をクリックしてイベントを選択した後、追加をクリックします。
注。タイムラインでのすべてのイベント発生は統計のために考慮されます。 - 情報のオプションを選択します。
- 左上にあるドロップダウンリストで情報のオプションをクリックします。
- 右上で統計情報のオプションのいずれかを選択します。
タイムレンジのダイアグラムは、選択中の情報に合わせて自動的に再構築します。
タイムレンジ分析で作業する場合は、現在選択されているタイムラインの統計が常に表示されます。上部にある現在ブロックで、操作対象のタイムラインを選択するフィルターに注意してください。詳しくは、現在のフィルタの効果を参照してください。調査されたタイムラン数を絞り込むために様々なフィルタリングを行ってみてください。
9/5/2024 4:23:55 PM