Milestone View
Overview
Milestone view lets you visually map the most common path of your business processes while displaying the auxiliary process flows. You can let the program take what it believes to be the most important milestones (events) through statistical analysis, or choose events yourself to build a process schema and visualize your entire business process.
With the help of this view, you get a demonstrative representation of actual workflows in your project. You can quickly identify process steps that are delayed and taking longer than expected. You can also discover areas with bottlenecks and drill into specific process instances to investigate root causes.
At the same time, you can compose an ideal workflow on a schema, and examine how it is different from the ongoing process. Find out what decision points can be made to improve the efficiency of the workflow and easily share your vision with your colleagues by exporting your schema as an image.
How to create Milestone schema
- Milestone schema is created by user, so its side is empty in new projects. The program prompts you to create your first schema. To get started, click the active Schema wizard text in the prompt message.
- If you already have saved schema configurations in the project, click New on the Content settings pane. It is recommended to begin with Schema wizard since it helps you to configure a basic schema in semi-automatic mode. Using the wizard is considered the main scenario in this instruction.
- Add events as milestones to the schema. There are 2 ways available:
- Click Select default milestones for the application to automatically select the most important events.
- Select the needed events from the list manually.
- Click Generate schema. The program will create a schema, based on the selected milestones. The schema display is completely adjustable, and events can be moved around to form a fully customized schema.
Note. If you are not satisfied with the received schema, click Clear to restart from scratch. - Adjust the schema configuration, if needed:
- Add more nodes.
Click Add event and select additional milestones from the list, then click Add. New nodes appear detached from the generated schema, so you need to place them and connect them to other nodes manually, as described in step 5.b. - Connect new nodes to the schema.
- Click a node, that you want to be the start of the transition, to see
 in them.
 - Click the "+" symbol, hold the mouse button and drag the appeared arrow to another node to define a transition to it.
Note. As it is a process schema, you need to connect nodes in the logical order keeping in mind that transitions are one-sided. If some events require to be connected in both directions, add two different transitions. - Clicking nodes also displays the following controls:
 to change the event in the node.
 to delete the node.
 - Click Rearrange to let the program restructure the schema to a straight up-to-down display.
- Set the Name of the schema by filling in the corresponding mandatory field at the left upper corner of the workspace.
- Click Save in the top right corner
The same functionality is accessible if you chose Edit on the schema controls bar below, so you can re-build your schema anytime.
Schema structure and configuration settings
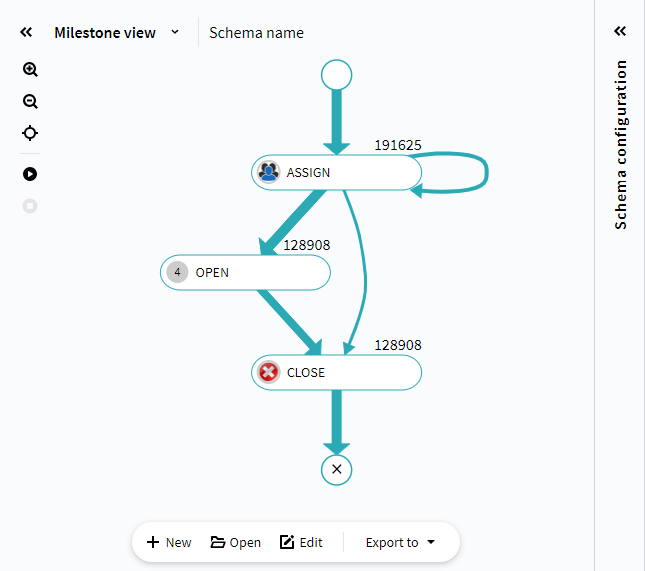
Milestone view is an updated vision of the former Process schema. It consists of nodes representing events that occurred in timelines, and transitions between them.
- Nodes
These are the milestones displayed on the schema. Milestones are the most important events in the process, that show the necessary workflow steps. Numbers near the nodes, by default, show the count of events belonging to them, which is also the number of occurrences of this particular event in the current timeline set. These numbers can also refer to the option selected in the Event analysis section of Schema configuration panel. Clicking a node will switch to the Location of option of Schema configuration, which shows the percentage of transitions going through the node with a specific event. - Transitions
Connection arrows between nodes show an itinerary of timelines on the schema. By default, the thickness of the transition lines represents the number of timelines that possess that transition. You can switch it to display the time length of that specific transition or make the lines identical to represent nothing. To do it, open the Schema configuration panel and select the needed option in the Line thickness section.
The schema structure and its content can be prompted by the program, but only you decide what set of events is displayed, and how these events are connected to each other. For details, see How to create Milestone schema.
The schema display and content can be adjusted with the respective settings:
Content settings
The schema controls are placed on a separate bar below it:
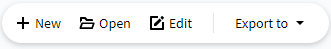
- New
Opens a workspace with the necessary tools for schema creation. - Open
Shows a window with a list of existing schemas.
Important. You can delete existing schemas only from this window. To do it, click .
. - Edit
Opens a workspace for schema creation preserving the current configuration. - Export
Saves the current schema configuration to your computer as a PNG image or a BPMN file.
Display settings
Adjust the schema to your screen with the help of the display buttons in the left upper corner: zoom in  , zoom out
  , and center
  .
.
Schema configuration
Milestone view can act as a monitoring platform. Play animation to see the movement of timelines of the current set between milestones. Adjust transition lines thickness and event markers to make the schema even more illustrative.
The Schema configuration pane is hidden by default, fix  to display it.
Configuration pane controls
Interaction with Board
Milestone view schema is self-sufficient and has no impact on the metrics placed on Board. However, applying the interactive elements on Tiles filters the number of events contained by the schema nodes.
For general information about boards, see Board.
For details on how boards are connected to Views, see Views and Boards Interactions, and Timeline Set Filtering.
15.07.2024 8:46:08