Analyzing classification results
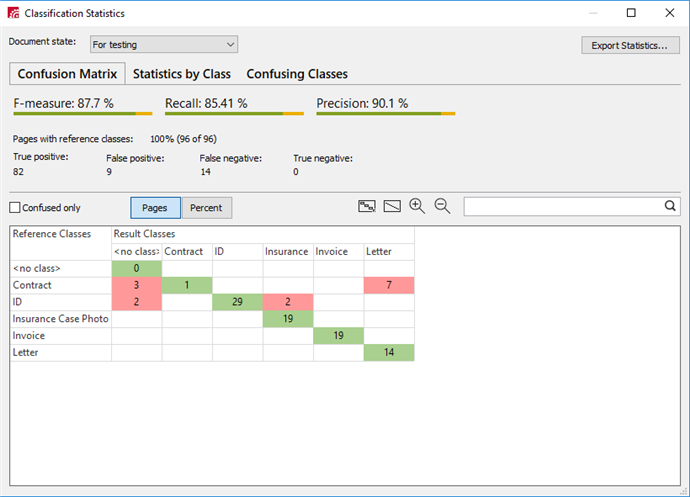
When the training is complete, classification statistics are displayed. You can use these statistics to improve the classifier.
To open the classification statistics window either:
- Select Classification Training → View Statistics in the main menu, or
- Click the
Statistics button on the toolbar.
The following information is available:
- F-measure, Recall,andPrecision – The higher these values, the more precise the classification results. (For more details about how the F-measure is calculated, see Glossary, Classifier F-measure).
- The number of pages with reference classes
- Page classification results:
- True Positive – The number of pages to which the reference class was assigned.
- False Positive – The number of pages to which a class other than the reference class was assigned.
- False Negative – The number of pages with a reference class to which no class was assigned.
- True Negative – The number of pages with no reference classes to which no class was assigned.
Use the drop-down list in the top left corner of the Classification Statistics window to choose if you want to show the statistics for For Testing pages, for For Training pages, or for both.
Detailed information about the ratio of reference classes to result classes, as well as information about the results of classifier training is presented in three different ways:
1. Confusion Matrix. The confusion matrix is a visual representation of the documents that are most often confused by a classifier. The values in the matrix cells represent the ratios of reference classes to result classes. Green cells show the number of pages to which a class was correctly assigned. Red cells show the number of pages with confused classes — classes that have been incorrectly assigned to pages with a reference class by the classifier.
Tools for working with the Confusion Matrix
Show the Confusion Matrix
2. Statistics by Class. A table containing statistics for pages for which the result class did not match the reference class. Lets the user identify the classes that cause the most errors for a given classifier. You can sort by number of confused pages, as well as by the ratio of confused pages to the total number of pages of this reference class.
3. Confusing Classes. This tab contains a list of all classes that have been incorrectly assigned by a classifier. Using this data, you can determine which classes are most often confused with each other.
Double clicking either a matrix cell or a data table row will open the pages for the selected classes. The reference and result classes search row is available on all tabs. You can also sort any data table to find out which classes are the most problematic.
For your convenience, you can export the statistics to a text file by clicking Export Statistics... in the Classification Statistics dialog box. In the dialog box that open, specify a name and location for the exported file and choose if you want to save it as a CSV or TXT file. You can also choose which statistics to export (select one or more options):
- Summary statistics for major classification parameters: F-measure, Recall, Precision and classification results broken down by page.
- Major classification parameters broken down by class.
- Confusing classes – the number and percentage of pages for each confusing class.
- All classes – the number and percentage of pages for each class.
Statistics will only be exported for the pages with the document state selected in the Classification Statistics dialog box.
 Important! You need to initialize the classifier training again if any of the following actions have been carried out:
- Added/removed documents with the For Training assigned;
- The For Training state has been assigned to or removed from a document;
- Classes have been added, deleted, or merged;
- A different reference class has been assigned to a document;
- A classification profile and/or the precision-recall priority have been modified.
4/12/2024 6:16:02 PM
 - displays the matrix using a fixed scale;
 - displays the whole matrix;
 - zoom in;
 - zoom out.