Workflow Analysis
Main Use
Workflow analysis is the first step towards improving your business processes, which in turn improves your business. Interestingly enough, a properly done business workflow analysis can be used for two things:
- Streamlining your manual business processes to make them more efficient
- Automating your business processes
To use this tool, select the Analyze > Workflow analysis menu.
Overview
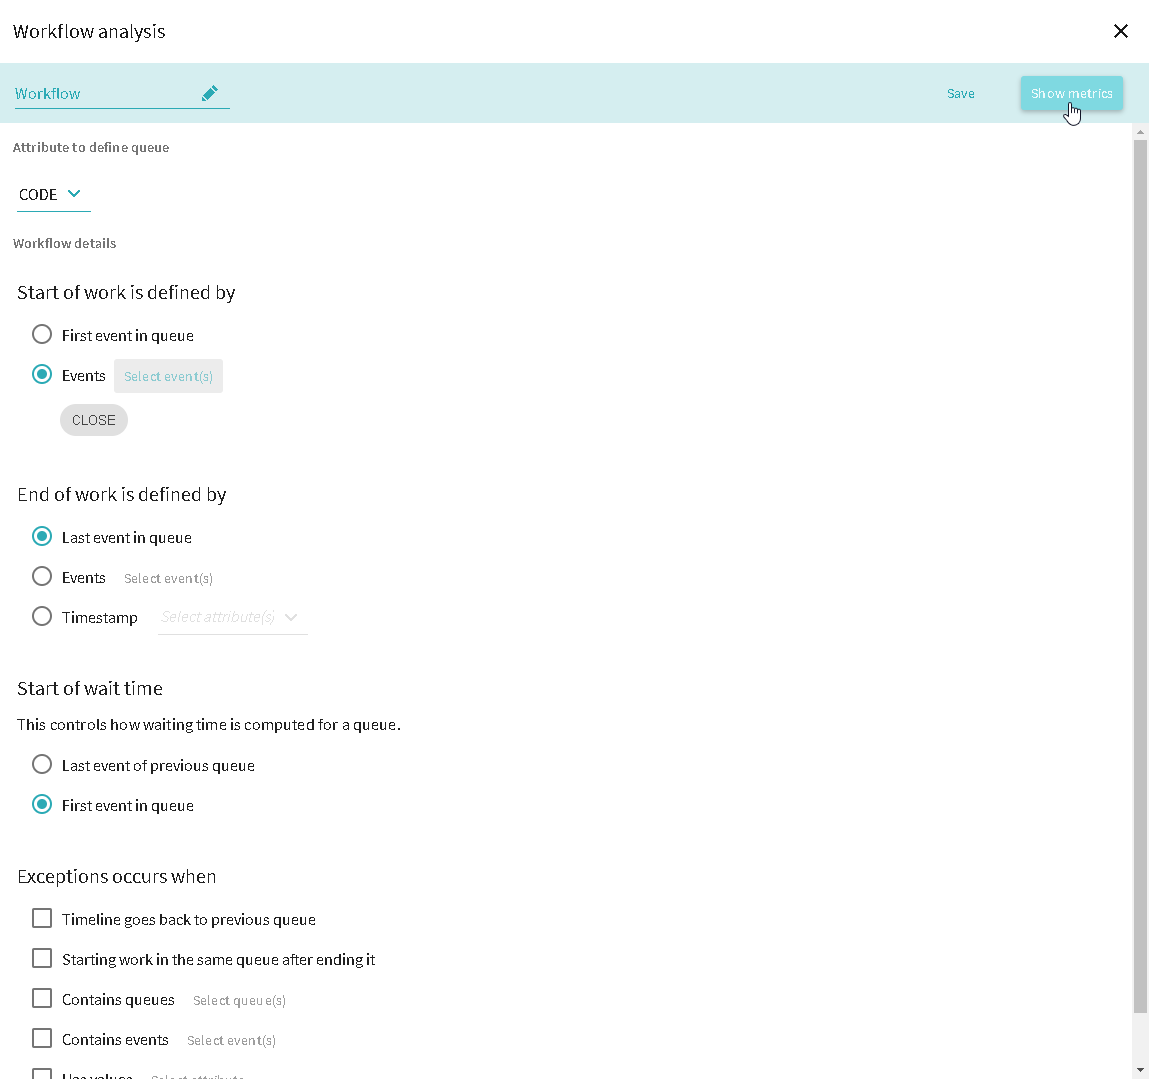
Set Up Queue
Analysis
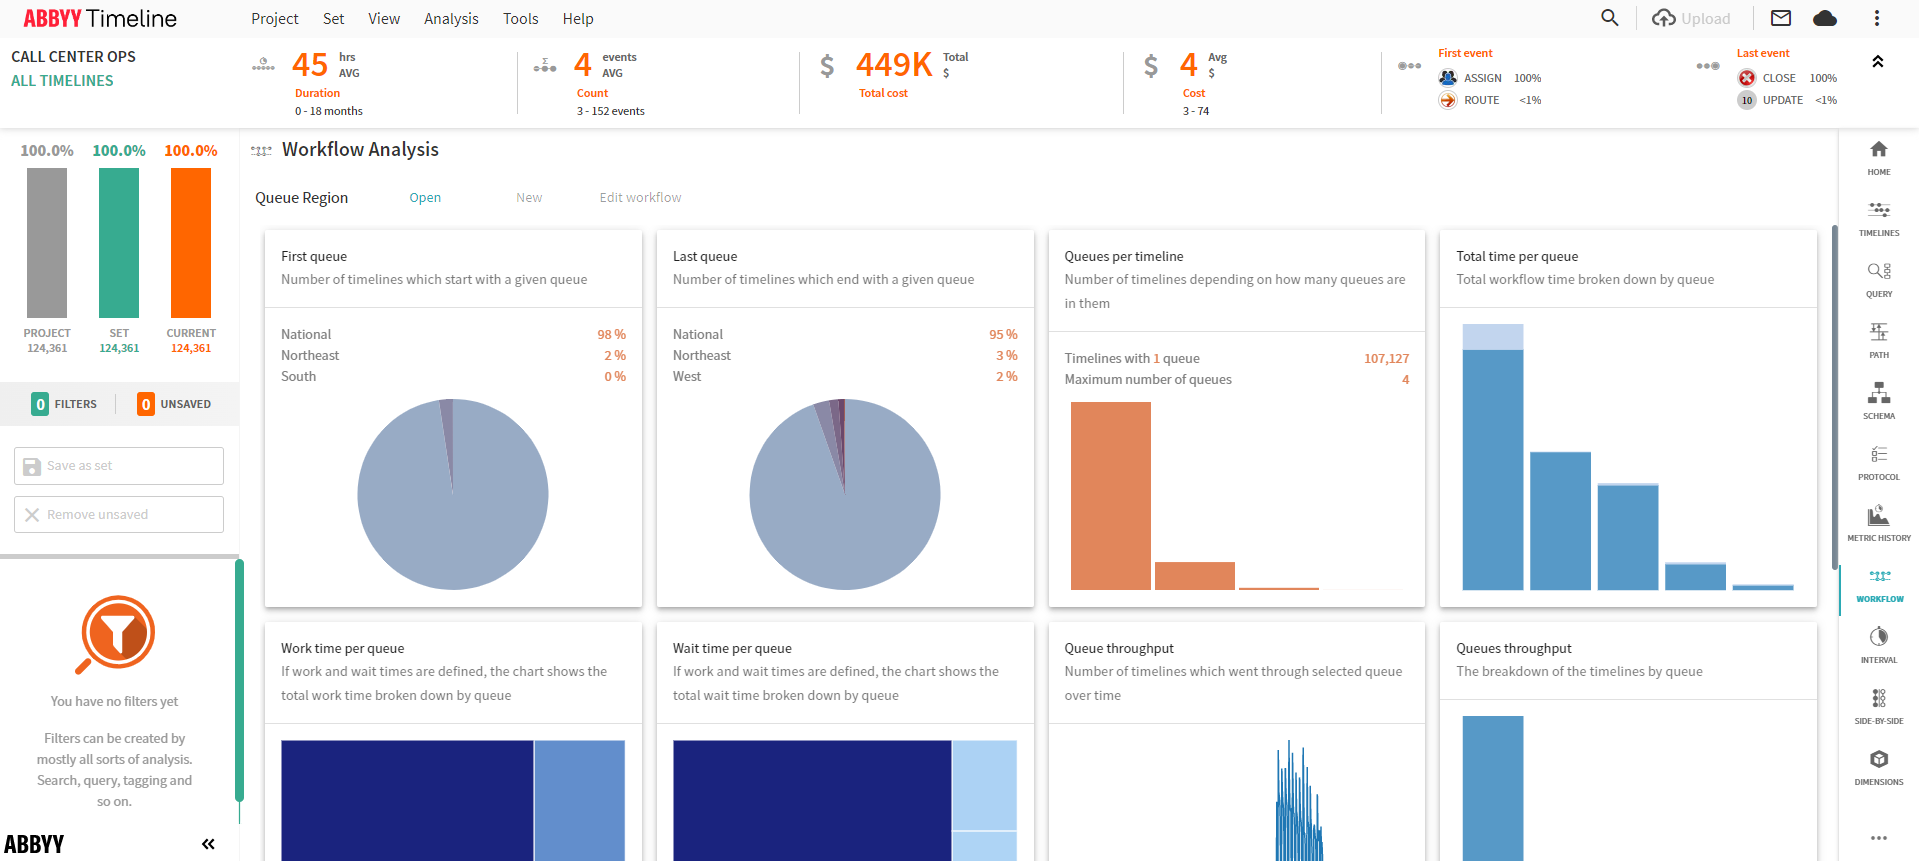
Total Time Per Queue
In all cases we need to calculate the total time per queue which could also be broken down into waiting time and working time.
For Queue start time there are two options:
- The last event of the previous queue
- The first event of this queue
Working and Waiting Times
There are many ways to define the working time. The waiting time is the difference between working and waiting.
For example, if start time is defined as the last event of the previous queue and start working time is defined as specific event Work and end working time is defined as second timestamp.
Queue and Event Aging
The queue aging chart is a part of workflow analysis and also makes sense as a standalone (with some difference in configuration). In both cases the chart shows how many timelines and for long were waiting for the particular event (as standalone chart) or sitting in a specific queue (as part of workflow).
Such number only makes sense for the specific time. For example:
- At 01/24/2017 at 15:00 there were 2400 timelines in queue AAA. Among them 1600 timelines were sitting there less than 3 hours, 500 timelines – between 3 and 6 hours, 300 timelines – more than 6 hours.
- At 01/24/2017 at 15:00 there were 2400 timelines waiting for event EEE. Among them 1600 timelines were sitting there less than 3 hours, 500 timelines – between 3 and 6 hours, 300 timelines – more than 6 hours.
As you could see the only difference is "sitting in queue" and "waiting for event". Here are the definitions:
- A timeline is sitting is queue at time T – if the configuration "Q started" is before T and the next queue is after T.
- A timeline waiting for the event E at time T – if the next event for this timeline after time T is the event E.
To configure the standalone chart user needs to define:
- Event
- Date range – the range of dates for which the aging should be displayed
- Step – the choice of Hour, 3 hours, 6 hours, 12 hours or Day, the intervals on which the aging will be calculated
- Two threshold values for age – max for green and min for red. The colors are predefined and not changeable
9/22/2023 8:59:47 AM