Detailed case (Instance) Analysis
Main Use
For many users this is the one place to see their entire process, events from various systems and locations, all in one place. This analysis tool is the true end-to-end visibility of a process instance and offers case management like details to evaluate the fine details of specific cases/instances.
To see a detailed analysis of an instance, open the information about a timeline. To do this, select the View > Timeline menu and click on the timeline line.
Overview
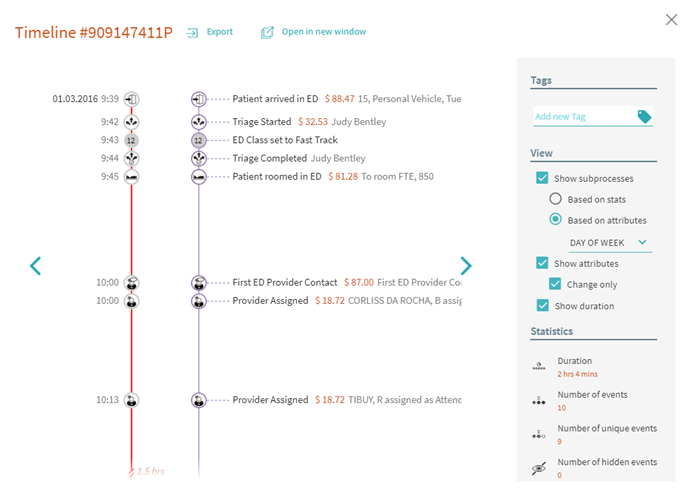
The Detailed Case (Instance) Analysis shows the details of a specific Timeline #x, which represents a singular process. Process instances can be analyzed in detail even where different steps in the process are performed on multiple back-end systems.

The column all of the way to the left is the super set of all of the events which occurred with this specific process. This is the place where process instances can be analyzed in detail.
Each event is displayed along with the attributes that correspond to that particular event.
You can export this timeline, the events and corresponding attributes to CSV by selecting Export at the top.
The Right Panel
Tags
Here new tags can be added, as well as all relevant tags for this timeline would be displayed.
View
You can select whether or not you want to see sub-processes broken out together either based on stats or on attributes.
You can also choose whether or not to display event attributes.
You also have the option to see the duration between the events in the timeline visualization, versus only seeing how the events were executed in order.
Statistics
This field shows statistics for the timeline:
Duration, Number of Events, Number of Unique Events, Number of Hidden Events, Maximum Gap, Minimum Gap, Average Gap, and Cost
22.09.2023 8:59:47