Task View Schema
Task View Schema is a graph that allows you to visualize which applications, forms and controls are involved while performing a certain task. Nodes of the graph show applications, forms and controls of the task. Task View Schema is generated by the program for each task separately.
To display a schema:
- Select a task in the Automation Candidates table.
- Click
 in the right menu.
Note. To generate a schema for another task, click the current task name in the upper left corner of the screen. Then select the needed task.
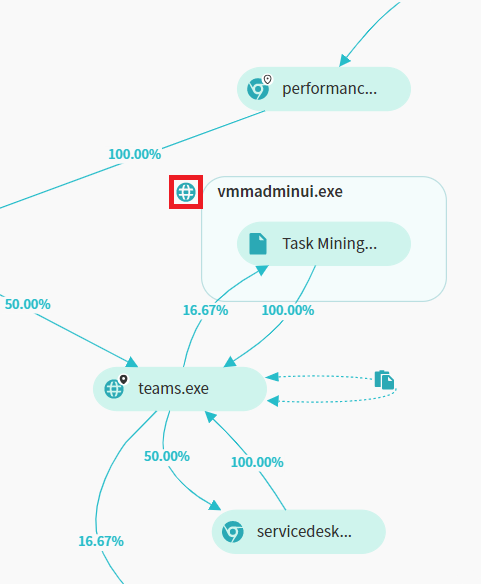
Schema structure
Task View Schema as a graph consists of nodes and connections between them. Nodes represent involved applications, forms and controls depending on the opened level. Transitions display connections between nodes and the percentage of timelines that pass through this node.
The schema has a hierarchical structure. Double-click the node to see a lower level. The graph will be restructured and show involved low-level nodes. A schema consists of:
- Application level
Displays applications as nodes of the graph. - Form level
Shows applications and used forms within them as nodes of the schema. When you open this level, the graph restructures to show the used forms within applications as nodes of the schema. - Control level
Shows controls of the selected form as a separate graph in a new window.
Note. A form control can be associated with a Process Analysis project event. For details, see Link project.
The program creates a schema according to the task definition. After schema generation, you see applications as nodes and transitions between them. To collapse a level, click the icon near an expanded application node:
22.09.2023 8:59:47