Path Analysis
Main Use
The Path Analysis tool is used to identify how the process is functioning by displaying the most commonly occurring process paths in a swim lane like fashion. This analysis tool is able to show where steps are being skipped, reoccurring, or functioning improperly.
To use this tool, select the Analyze > Path analysis menu.
Overview
The Path Analysis tool will show exactly how the process was completed with the most commonly followed paths of the events selected with a check, to the left.
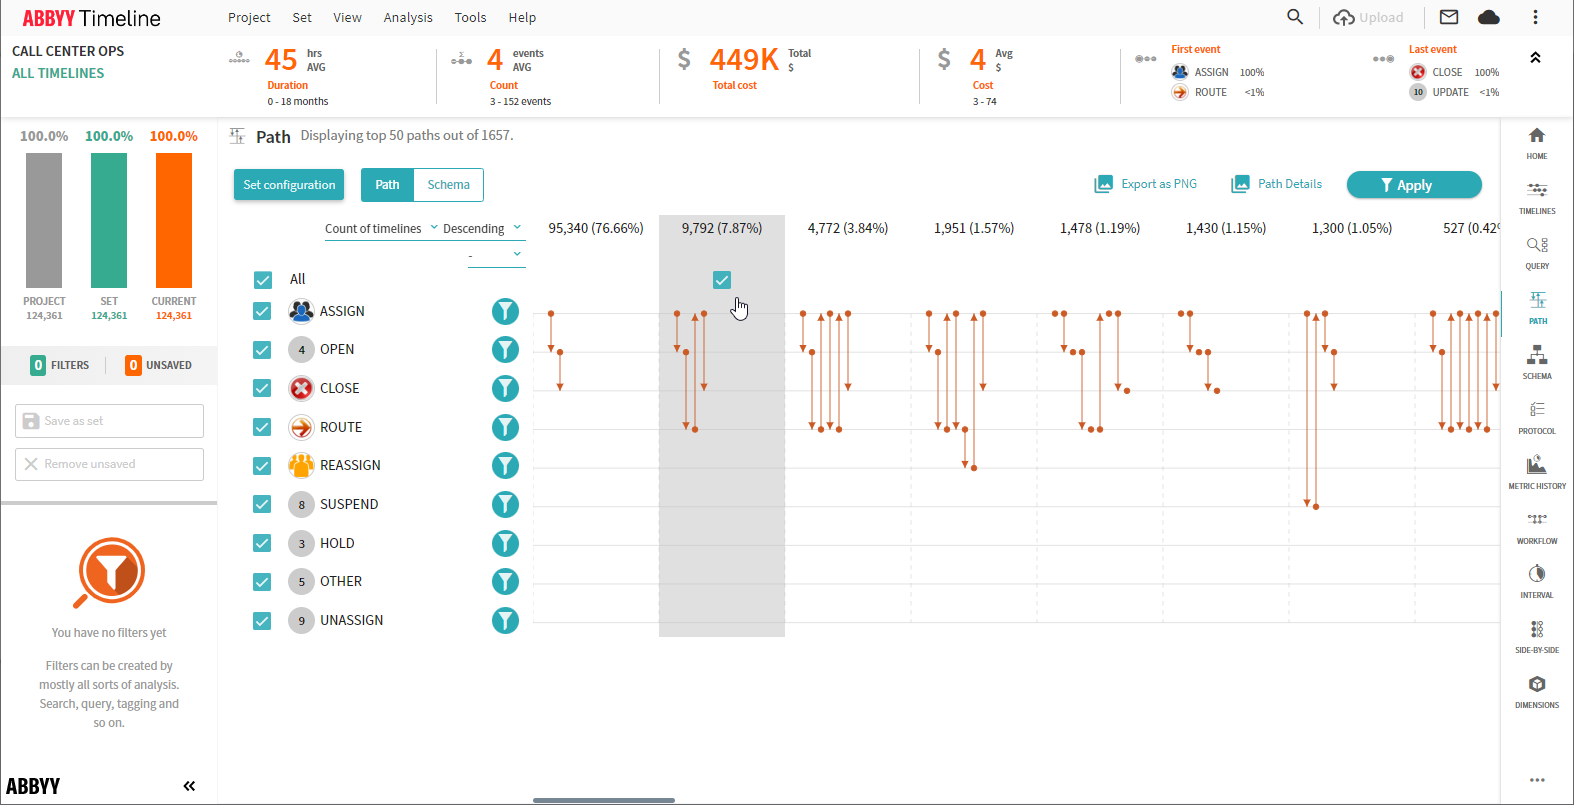
The tool suggests the steps (events) along the left with the check mark, but you can change what events should be included at any time. As you adds/removes steps (events) in the process the application dynamically changes, and it recalculates the processes’ percentages of frequency along the top. The process paths are ordered from most to least frequently occurring going from left to right. This allows for a fast analysis that clearly exposes when steps (events) have been skipped over, done repeatedly or totally out of order.
At the top above the swim lanes includes a label where you may select metrics to view. Fro example, Count of timelines and average duration. You can further analyze these trends by comparing them to other sets using the Side by Side Comparison tool.
The Path Analysis provides you with two distinct views that you can switch between – the Path View and the Schema View. The Path View provides you with more of a linear view of the process and access to where steps (events) are being repeated, skipped, or performed out of order. The Schema View allows you to view steps that may be done at the same time and the order of events within a particular path. Both views provide side-by-side analysis capability and can be compared by the count of timelines, average duration, average business duration, average number of timelines, average cost, and total cost.
Example
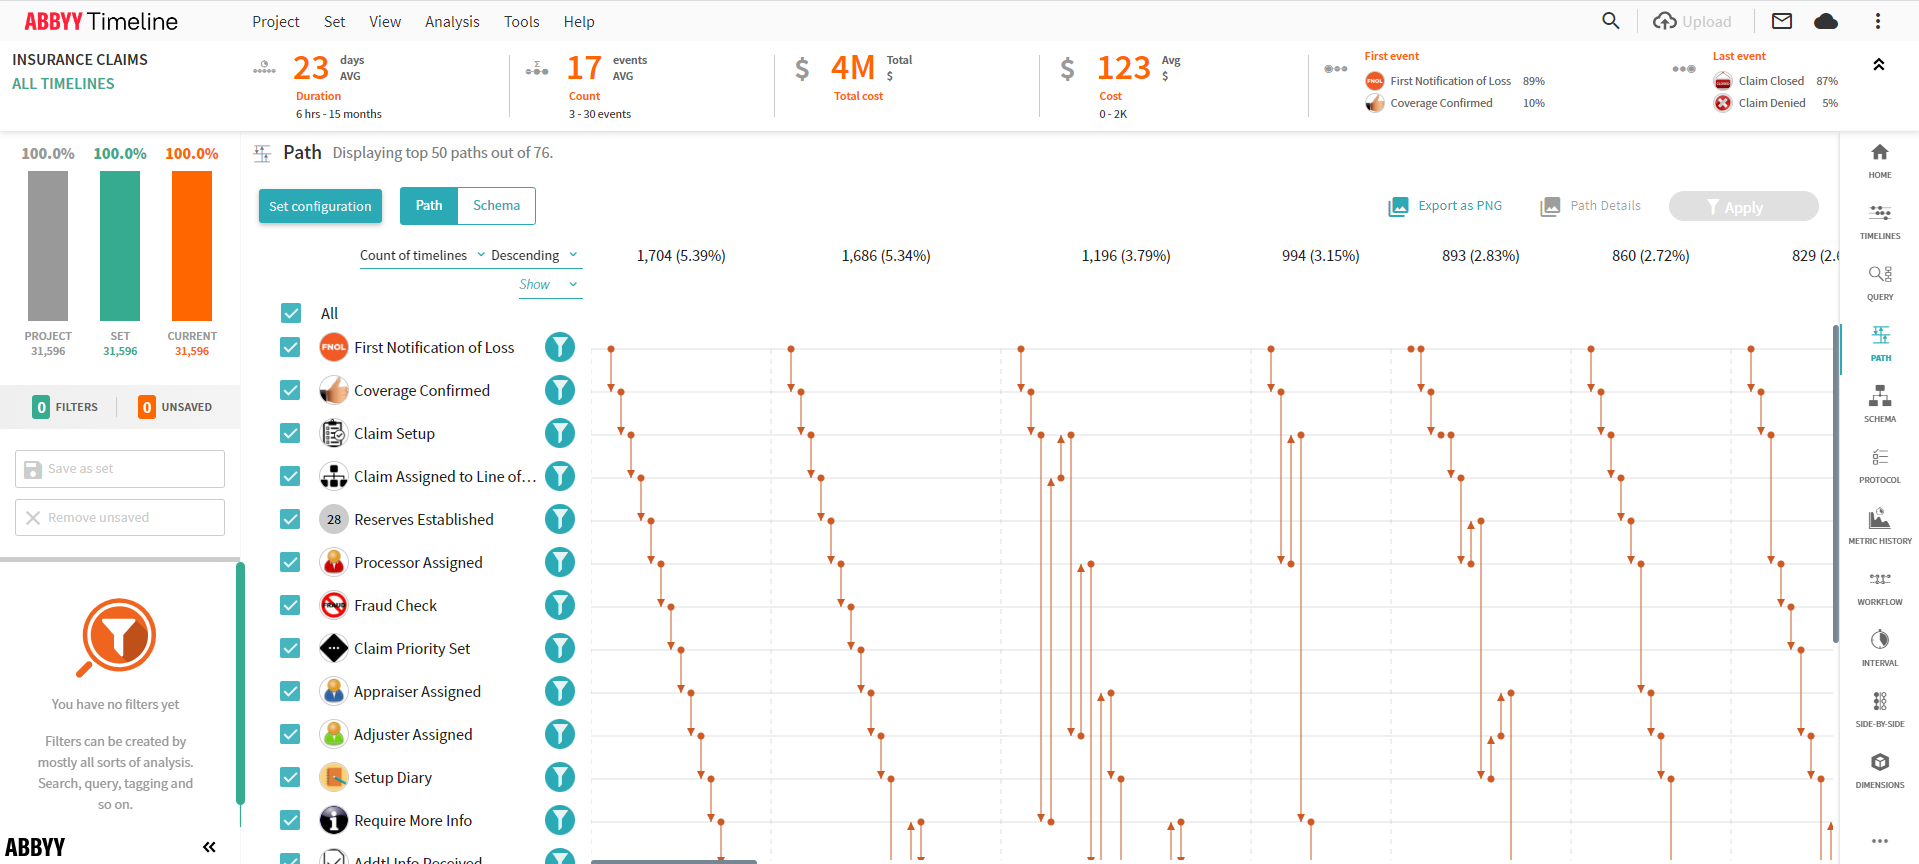
In this example, an insurance claims process is being analyzed. Below are the paths that were generated in decreasing order from most to least frequently occurring in the Path View. As you can see there were specific events that were automatically generated as important. With the Average Cost metric also displayed we are able to see what process we should really focus attention on.
Path View
You can then switch the Schema view in order to see tasks that are completed simultaneously.
Schema View
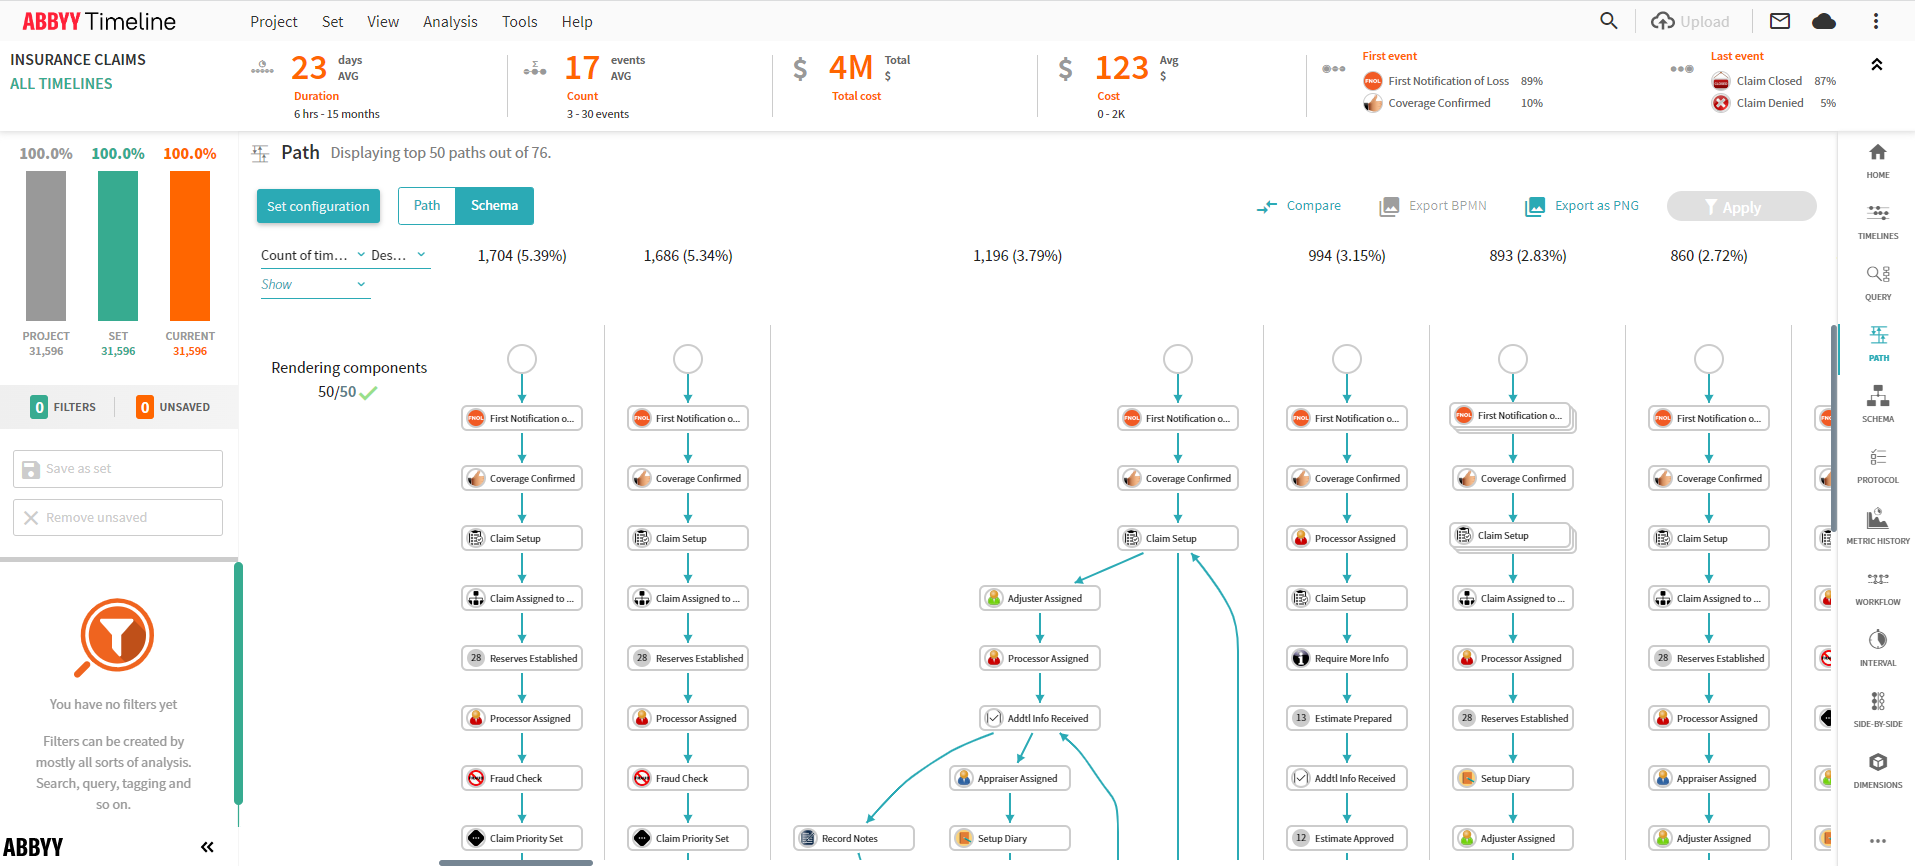
You are able to select any particular path or paths in either the Path or Schema View in order to create a filter on the data for deeper analysis.
9/22/2023 8:59:47 AM