English (English)
Automation Candidates
Once the tasks are identified and the logs are cut, Timeline will create a list of tasks that can be automated. Each task instance will be represented by a separate timeline, which you can analyze using any of the available analysis modules.
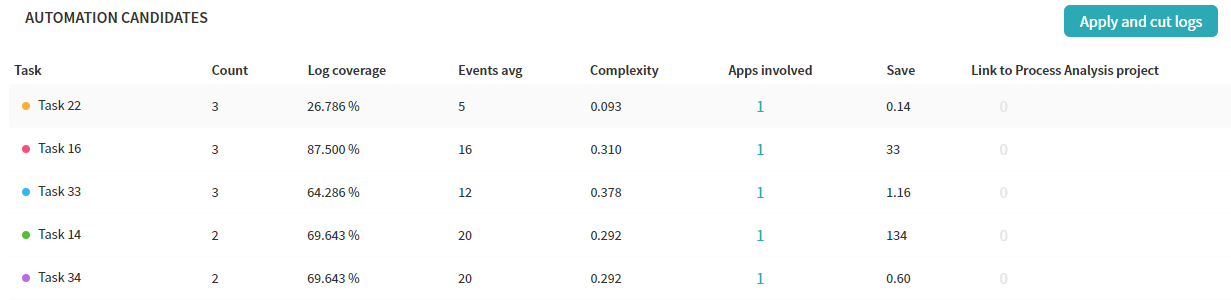
The Automation Candidates table contains the following columns:
- Task
The name you gave to the task when defining it. - Count
The number of identified task instances in the logs. - Log coverage
The percentage of the forms in the logs that are related to the task. - Events avg
The average number of actions involved into the task (e.g. clicking a button, opening a tab, etc.). - Complexity
The complexity of the task, determined based on the number of task variations, the number of forms, and applications involved. The greater its value, the more complicated the task to perform. - Apps involved
The number of applications used when performing the task. Click the number to see the names of the applications. - Save
The money you can save by automating the task. You need to specify the cost of the tasks to see this value. - Link to Process project
You can associate controls from your current Task Mining project with events from process analysis projects using Task View Schema. Click the number to see information about connected projects.
22.09.2023 8:59:47