Overview Page
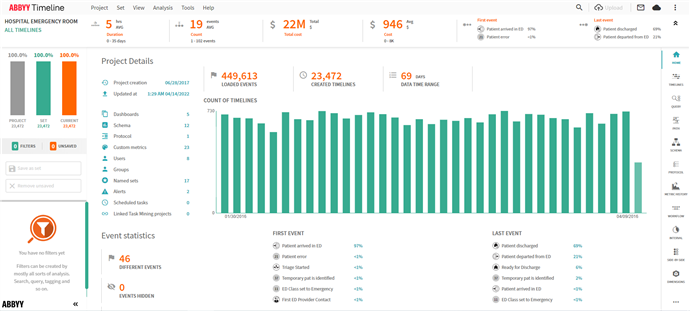
After uploading data, you will be displayed an overview page like the one shown below. This overview page displays numerous metrics which have been automatically calculated from the data, as well as the many different analysis tools on the right menu.

The metrics on the overview page include the number of timelines in the current set and its percent to all timelines (which will change as you further scope and further define your analysis), the total and average duration of the process, the number of events per timeline and how many of them are unique (events can be duplicated or done multiple times in an unique encounter), time gaps where work is not being completed and also the distribution of the first and last events in the timelines (which events most commonly both start and finish the process).
Additionally, the overview page will display when the project was created and when the data was last updated. The overview page will also show the number of saved dashboards, schemas, protocols, custom metrics, project users, named sets, and alerts.
Note: To open the Overview page, select View > Home.
What is a Timeline?
A timeline is just the history of a process instance. It is the history of a sales order, an invoice, an insurance claim, a service ticket, or a specific process over time. A timeline simply consists of events which state that something happened to this "thing" at a specific time.
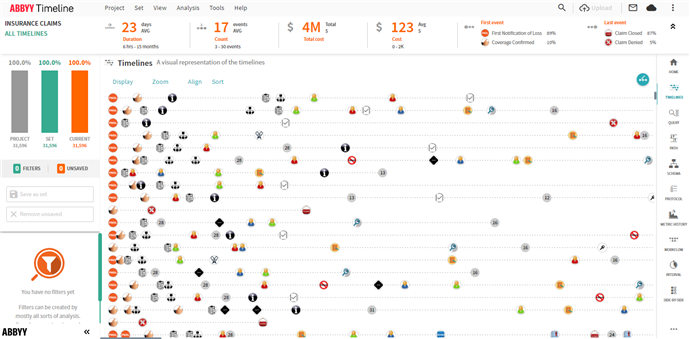
To view all the timelines in your project, select View > Timelines or click the Timelines (![]() ) button on the right. Each timeline will be displayed as a chain of event icons, which can be sorted by time, duration or number of events.
) button on the right. Each timeline will be displayed as a chain of event icons, which can be sorted by time, duration or number of events.

9/22/2023 8:59:47 AM