Processing error diagnostics
In the web Administration and Monitoring Console, you can view an event log and identify tasks that have been processed with errors.
The FlexiCapture Cloud REST API assigns a unique identifier to each new task. After that, a batch with the same name is created in FlexiCapture Cloud and is queued for processing. To check the status of a task based on its ID, follow these steps:
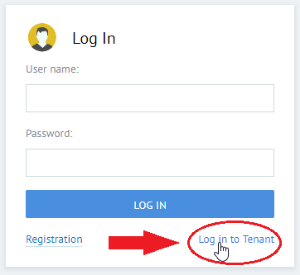
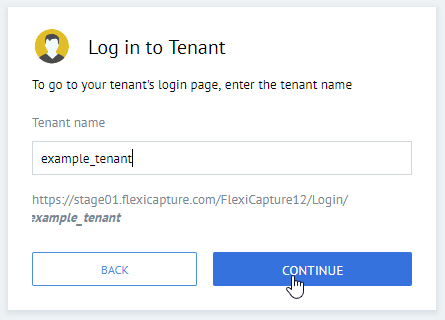
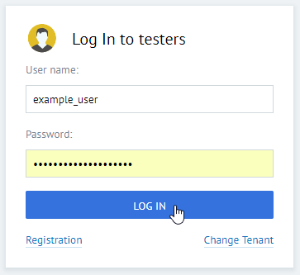
- Enter your account credentials to log in to the web Administration and Monitoring Console on your tenant.


- Click Processing Monitor and then click Event log.

- Click the + icon to create a new filter to look for the batch that has the same name as the ID of the task you are looking for.

 Note: After you enter the ID in the field on the right, make sure you click the matching ID that appears in the tip below the entry field, otherwise the filter will not work.
- Click Apply.
- Review the task status and any errors found in the task.
- If you are unable to fix an error, contact the technical support team.
 Note: The batch ID in FlexiCapture Cloud will not match the task ID in the FlexiCapture REST API.
For the description of HTTP error codes that may be returned to REST API requests, see Request errors.
18.05.2023 9:30:10